AI features (LLM)
DataQ can call a language model you choose for three jobs: turn a sentence into a custom-SQL check, propose a starter set of checks for a table, and explain why a check failed. All three are off until an Admin configures a provider, every call is recorded, and no failing-sample row ever leaves your deployment. This page shows each one with what goes in, what comes back, and what the model is never shown.
Admin → Settings → LLM provider: point DataQ at a model, press Test, save. Here it is a local Ollama server; the same form takes Anthropic, Azure OpenAI, Bedrock or any OpenAI-compatible endpoint.
Turn it on
Admin → Settings → LLM provider. Pick a provider, enter the model name and (for OpenAI-compatible endpoints) the base URL, paste the API key, and press Test — it makes one tiny call with the values in the form and reports the model and latency. Nothing is saved by Test, but the probe itself is recorded like any other call, and it runs whether or not the enable switch is on. Then Save and switch on Enable outbound LLM calls.
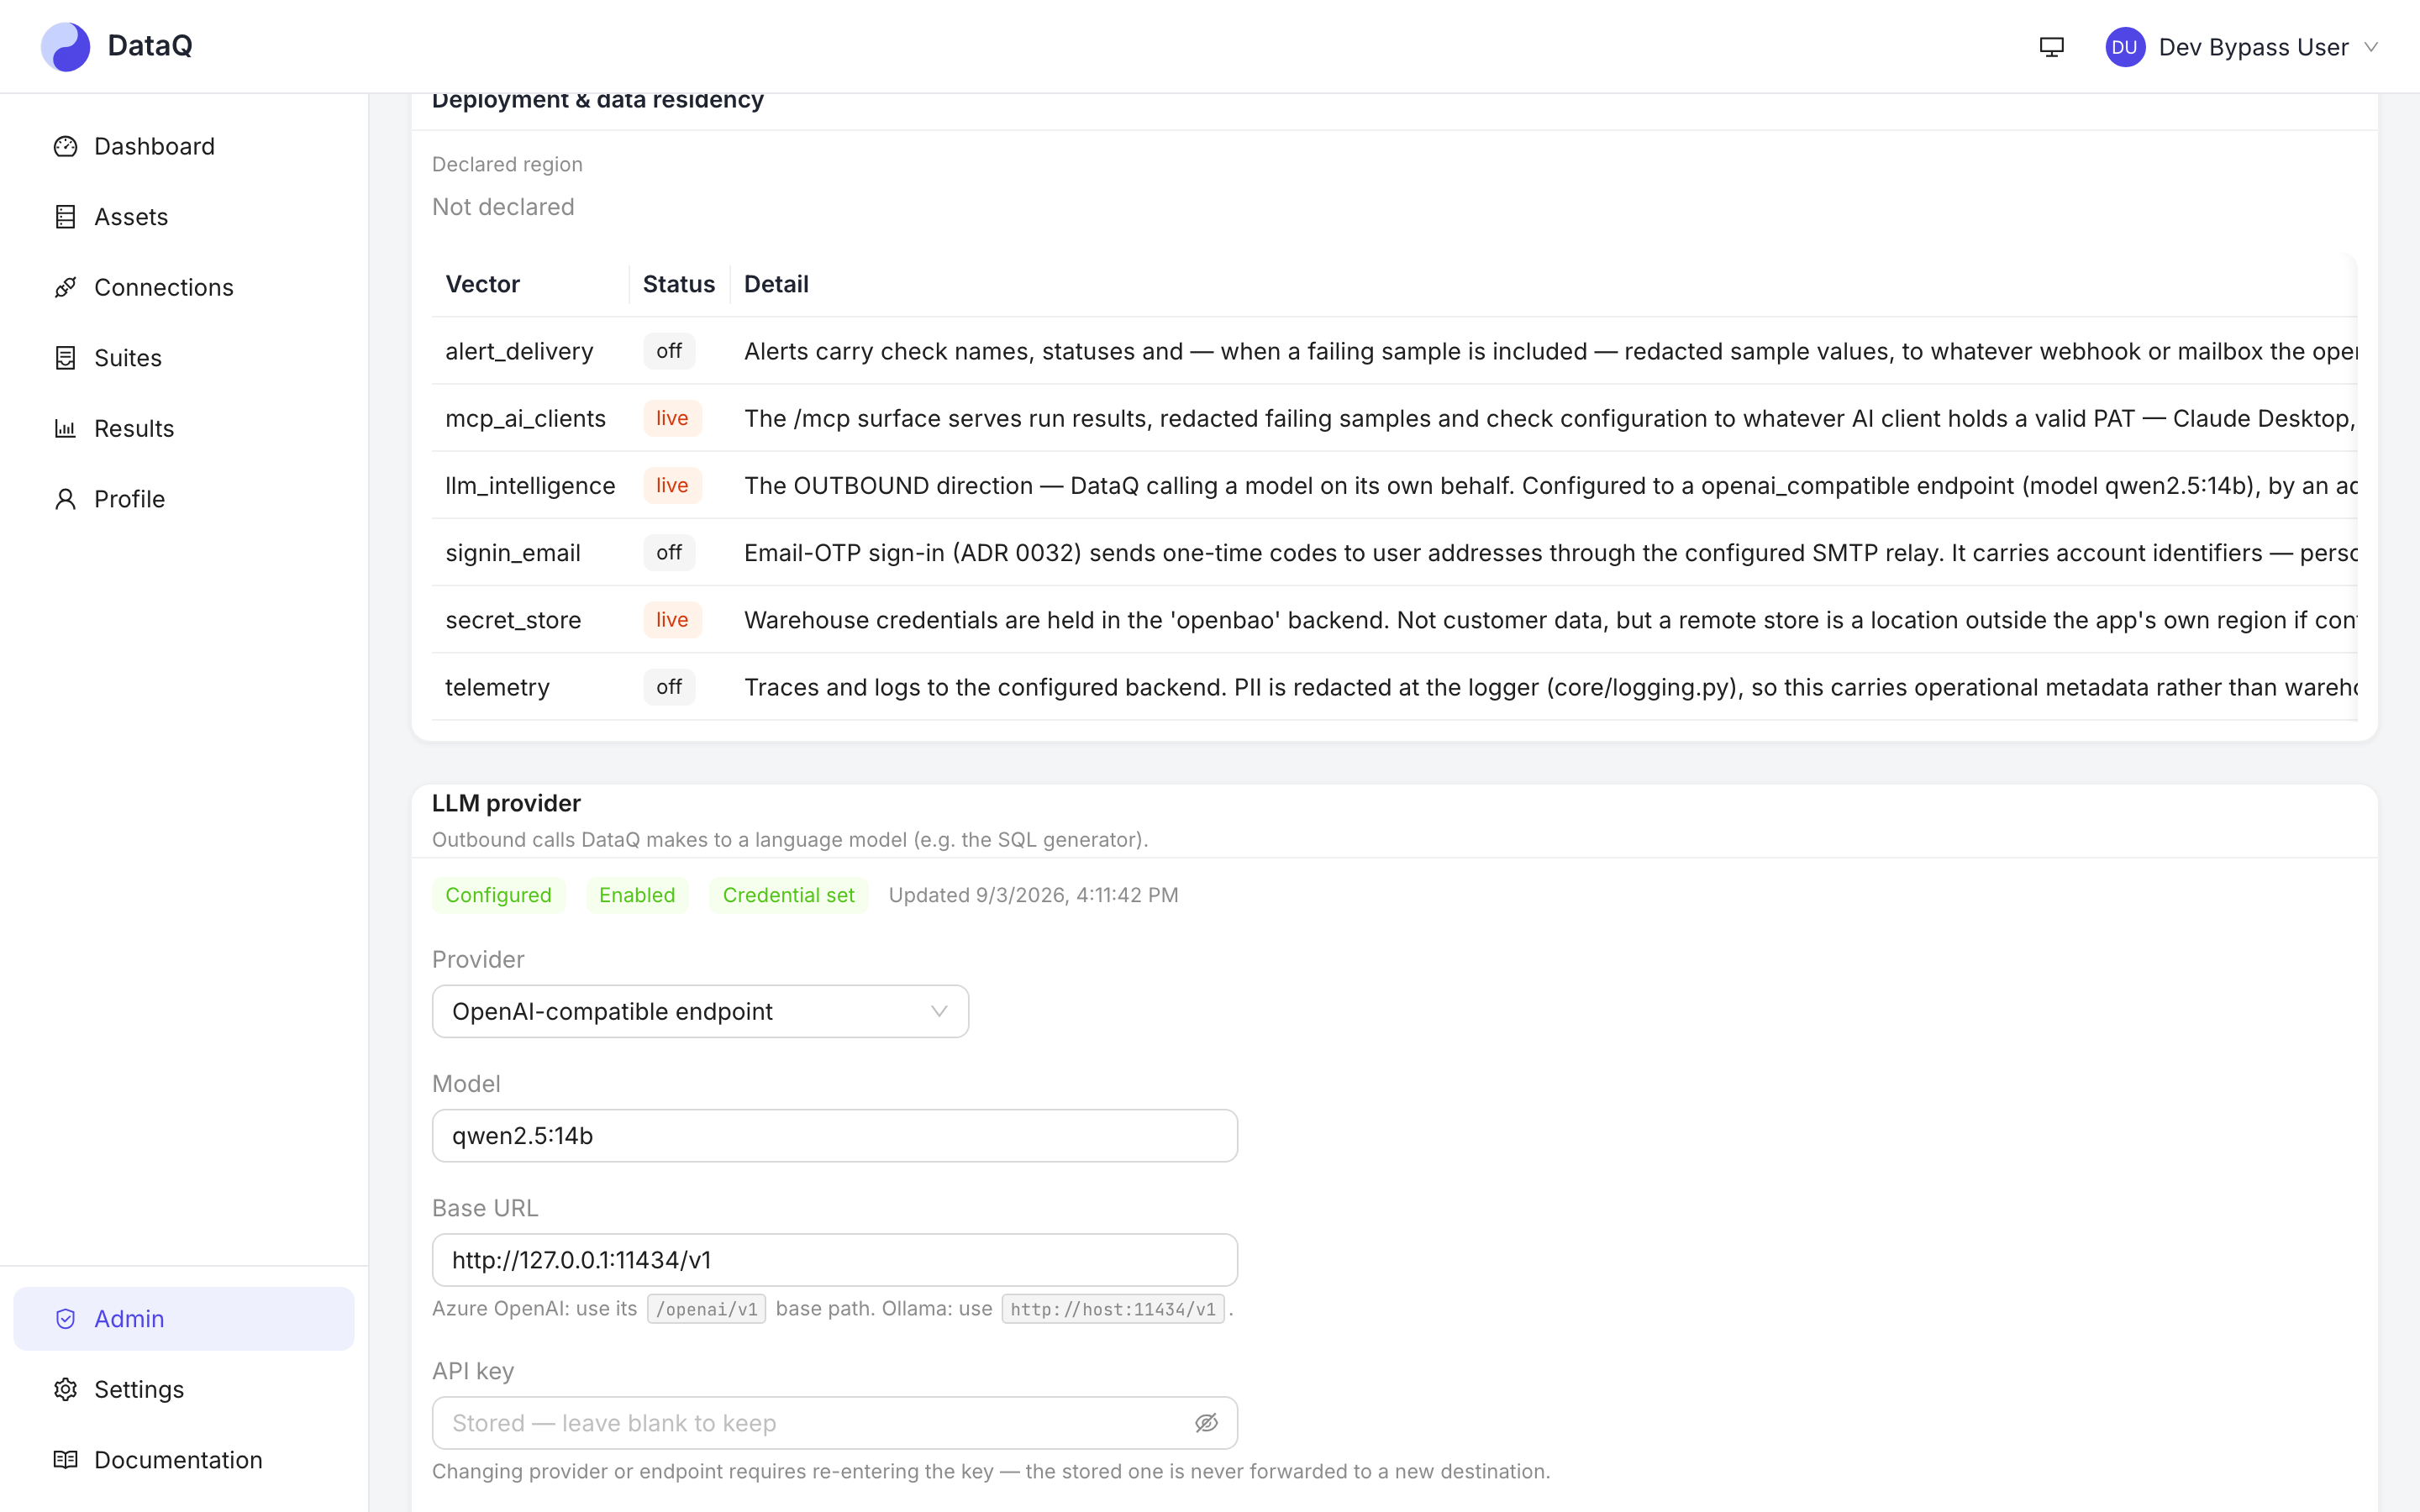
The key is write-only: it is stored in your secret store, never shown again, and never forwarded if you later change the provider or endpoint — you re-enter it on purpose.
| Provider | Base URL | Notes |
|---|---|---|
| Anthropic | leave blank | Native structured output. |
| OpenAI-compatible | required | Azure OpenAI (…/openai/v1), AWS Bedrock, vLLM, TGI, Ollama (http://host:11434/v1). |
Structured output decides how DataQ gets JSON back. Native uses the provider's own schema or tool-calling support; Prompt-JSON fallback embeds the schema in the prompt and repairs one parse failure — use it for small local models. Either way DataQ re-validates every response against the same rules a human's input would face, so the mode changes reliability, never safety.
What the model can and cannot see
Nothing sends failing-sample rows. Beyond that, each feature sends something different:
- SQL generation — the target's column names, plus null and distinct counts per column if you ask for the profile. No values.
- Check suggestions — column names with null/distinct counts, min/max, and the five most frequent values of each column. Columns your column policy or warehouse tags mark sensitive are blanked to a mask; an unclassified free-text column is not, so classify before you enable this on a table with one.
- Root-cause narrative — the stored evidence card (check, asset, pipeline and downstream identifiers, statuses, metric values, the observed and expected values after the same column-policy / warehouse-tag redaction every results surface applies) plus up to 180 points of that check's result history from DataQ's own database. No column profile at all.
The full transfer-vector accounting is in Security & data handling, and the live list for your deployment is on Admin → Compliance, and the provider itself is configured on Admin → Settings.
Explain a failed check
When a check fails, DataQ opens an incident and captures an evidence card at that moment: the failing result, the metric's recent trend, the other checks in the same run, the upstream pipeline run if one triggered it, and the downstream tables that depend on the asset. Open it from the asset page:
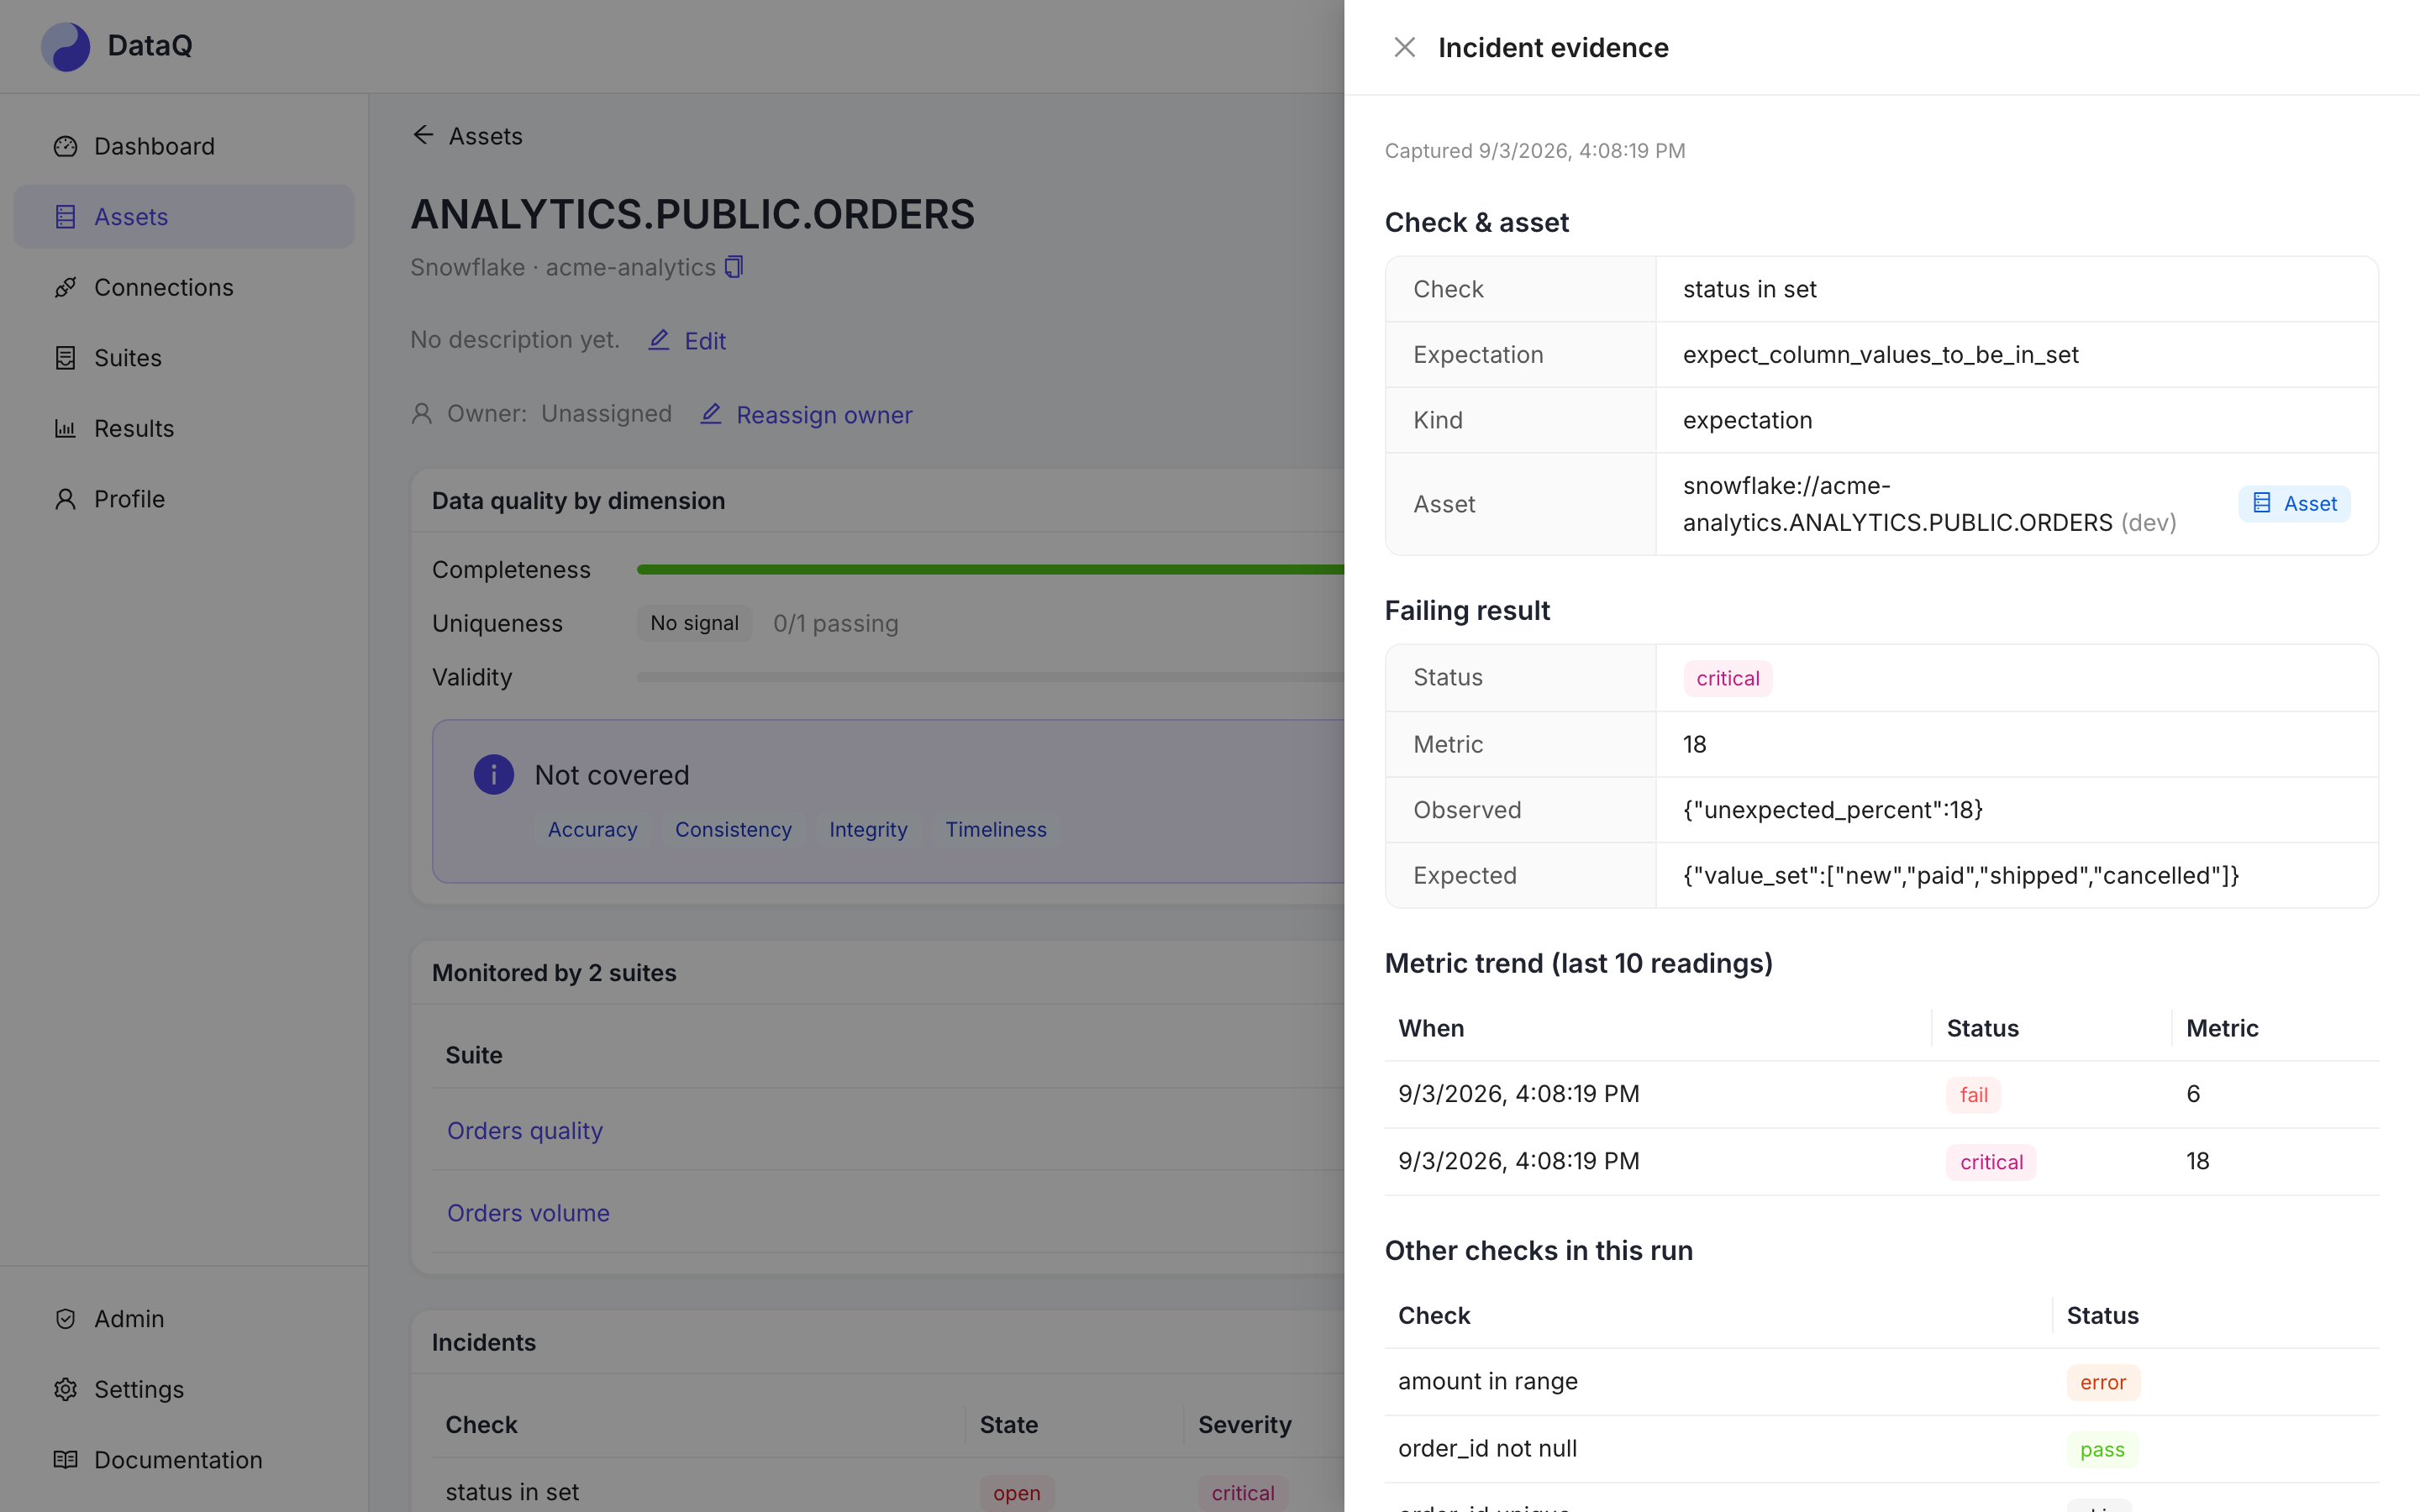
Click Explain this failure (or Regenerate, once one exists) at the top of the Root-cause narrative section:
The narrative renders in its own bordered card. The ⓘ next to the title is what the model was sent; the ⓘ next to the timestamp is what the evidence card could not see, both on hover rather than always on the page.
The narrative itself:
- Every hypothesis cites evidence layers from a closed list (
failing_result,metric_trend,sibling_checks,upstream_pipeline_run, …), shown as tags under each one. A hypothesis that cites none is dropped before you see it; if the model produces nothing citeable, the generation fails instead of returning an empty story. The model is told to keep those citations in the tags, not repeat the layer names inside its own sentences. - Blind spots are computed by DataQ, not the model — hover the ⓘ next to the timestamp. It lists what the evidence card structurally could not see (no linked pipeline run, no lineage, no before/after profile), and the prompt forbids the model from asserting confidence over those gaps.
- The narrative reaches the next alert. Once one exists for an incident, the Teams / Slack / email / webhook line for that incident carries its one-line takeaway — unless other suites also check the same asset, in which case the alert withholds it, since the narrative may name a check the alert's audience is not granted to see. The generic webhook channel is the exception: its JSON payload carries the whole narrative object.
Generating the narrative needs view on the incident's suite. Reading it back is narrower:
only the person who requested it, or a workspace Admin, can poll it — a colleague with the
same suite grant gets a 404 for your invocation id and has to request their own. It never
re-runs the check and never changes the suite.
Scripted / MCP access
curl -X POST https://<your-dataq-host>/api/v1/llm/rca_narrative \
  -H "Authorization: Bearer dq_live_…" -H "Content-Type: application/json" \
  -d '{"incident_id": "<incident id>"}'
# → 202 {"invocation_id": "5e7c…", "status": "pending"}
GET /api/v1/llm/invocations/{invocation_id} until status is succeeded or
failed; the response is the same {summary, ranked_hypotheses, blind_spots,
suggested_next_checks} shape shown above.
Write SQL from a sentence
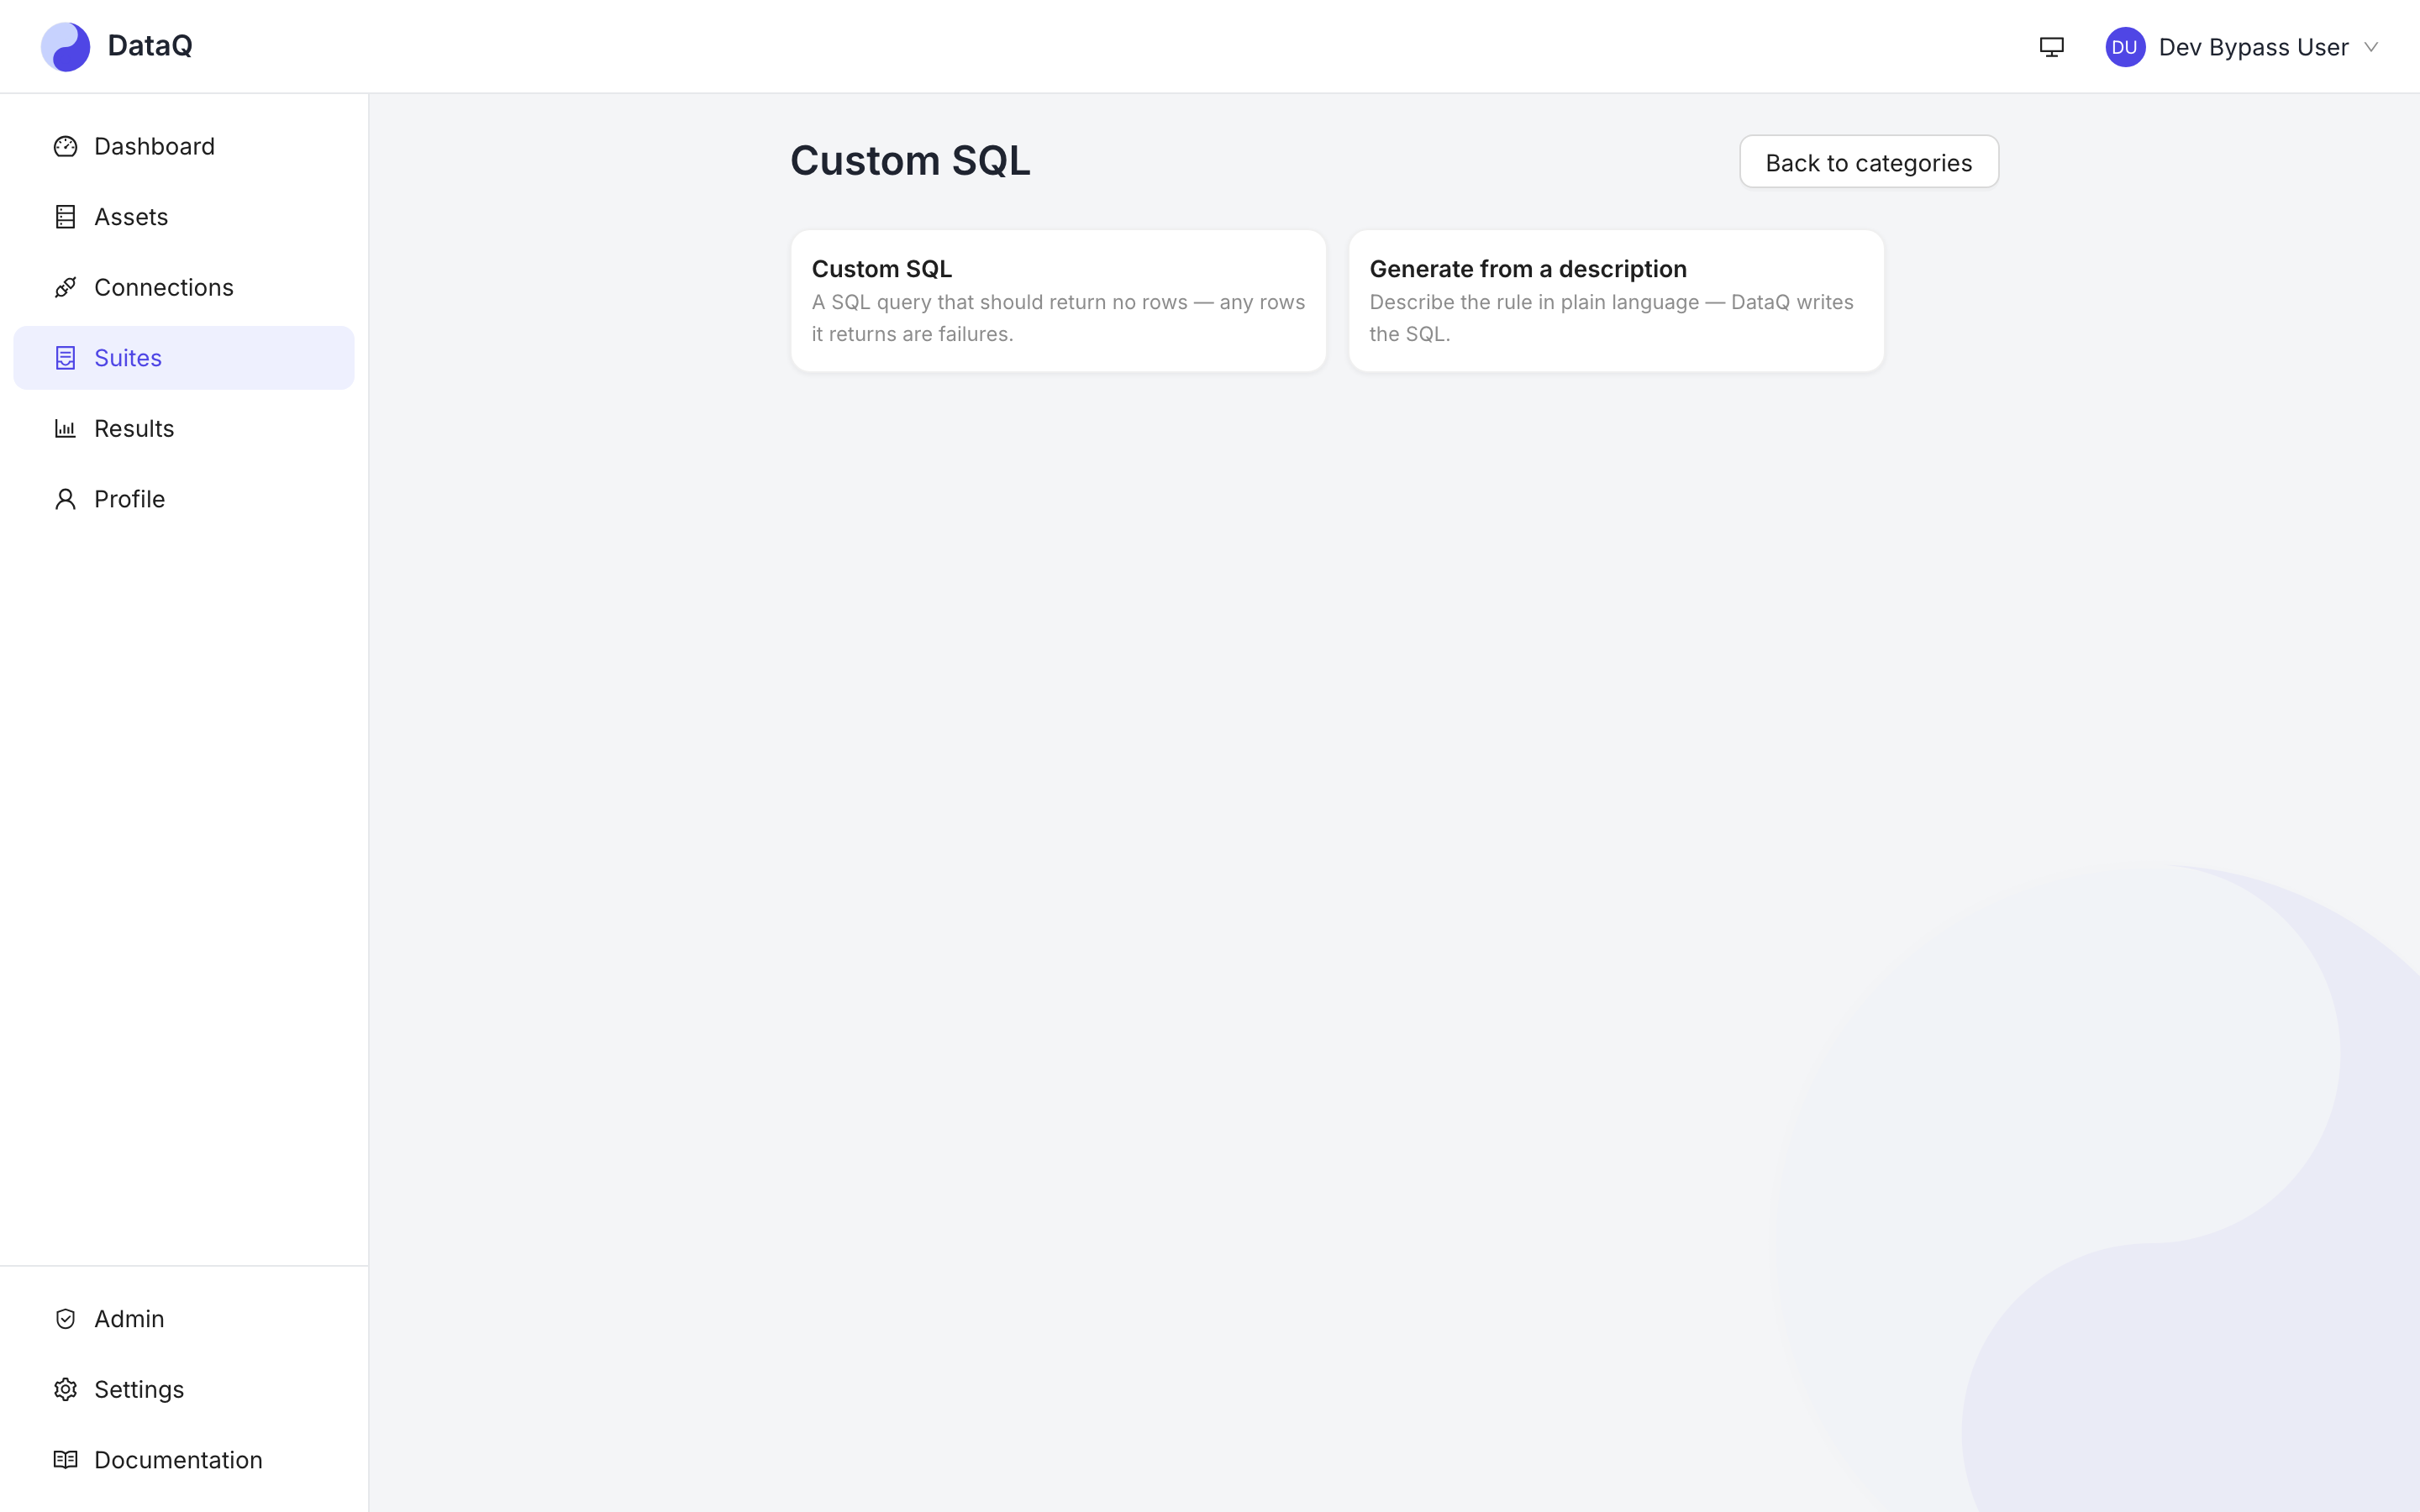
Custom-SQL checks are the most flexible check type and the slowest to author. On a suite whose target is a table on a SQL datasource (Snowflake or Unity Catalog), start a check, pick Custom SQL, and describe the rule instead of writing it. Generate from a description sits beside the hand-written Custom SQL card — same check type underneath, just a different starting point:
DataQ lists the target's columns from the warehouse, adds masked profile statistics if you
tick Include column profile, and asks for one read-only SELECT. The model's SQL
then passes the same validator a human's custom SQL does — a single SELECT / WITH
statement, nothing chained after a ;, no write or DDL keywords — before it lands in the
editor:
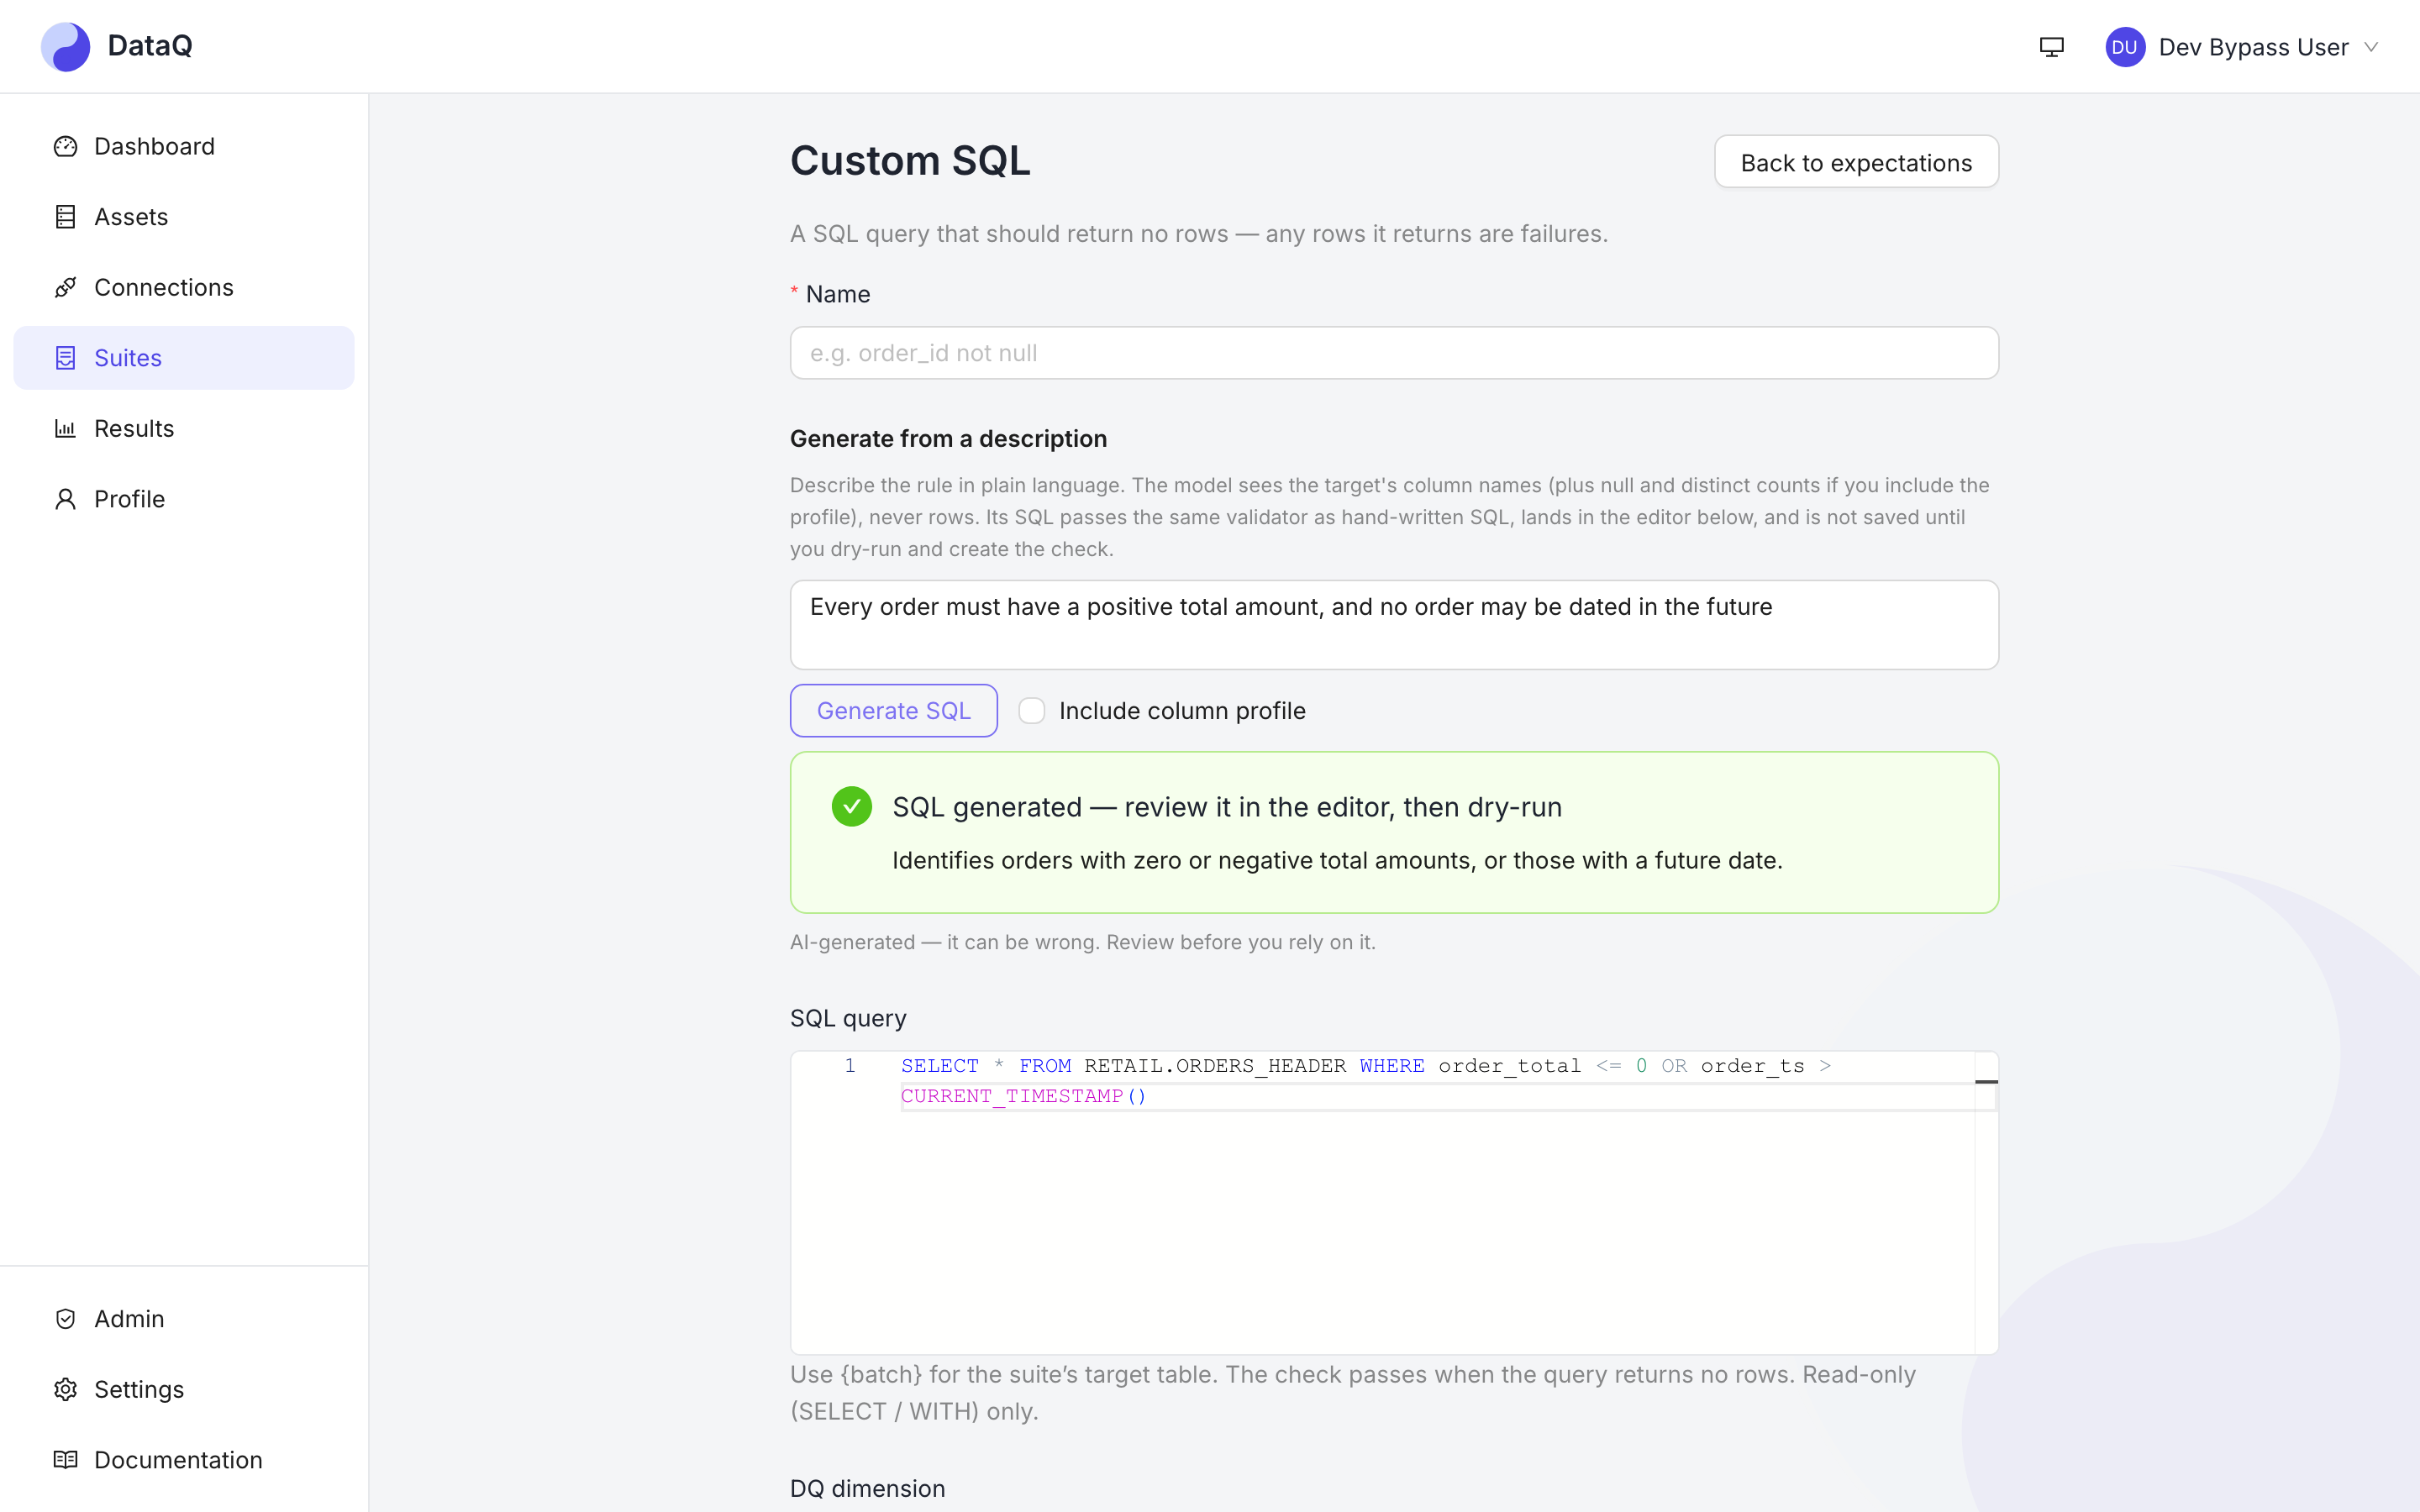
Nothing is saved yet — review the SQL, dry-run it, then create the check like any
hand-written one. For a rule that spans several tables on the same connection, add
additional_tables (up to four) via the API; cross-connection joins are refused
structurally, because reconciling two datasources is what the
comparison check is for.
Scripted / MCP access
curl -X POST https://<your-dataq-host>/api/v1/llm/sql_generation \
  -H "Authorization: Bearer dq_live_…" -H "Content-Type: application/json" \
  -d '{
    "suite_id": "<suite id>",
    "description": "Every order must have a positive total amount, and no order may be dated in the future",
    "include_profile": true
  }'
{
  "sql": "SELECT order_number, order_total, order_ts FROM RETAIL.ORDERS_HEADER WHERE order_total <= 0 OR order_ts > CURRENT_TIMESTAMP()",
  "explanation": "Identifies orders with a non-positive total amount or with an order timestamp in the future."
}
Suggest checks for a table
For a suite with a table target and no checks yet, click Suggest checks on the checks card:
DataQ profiles the table's columns live (masked statistics only), sends the profile with a closed vocabulary of check types — a subset of the check editor's catalog: column-level value, null, set, range, regex and uniqueness checks, but no row-count or cross-column types — and gets back candidate checks, each with a name, a rationale and a full config:
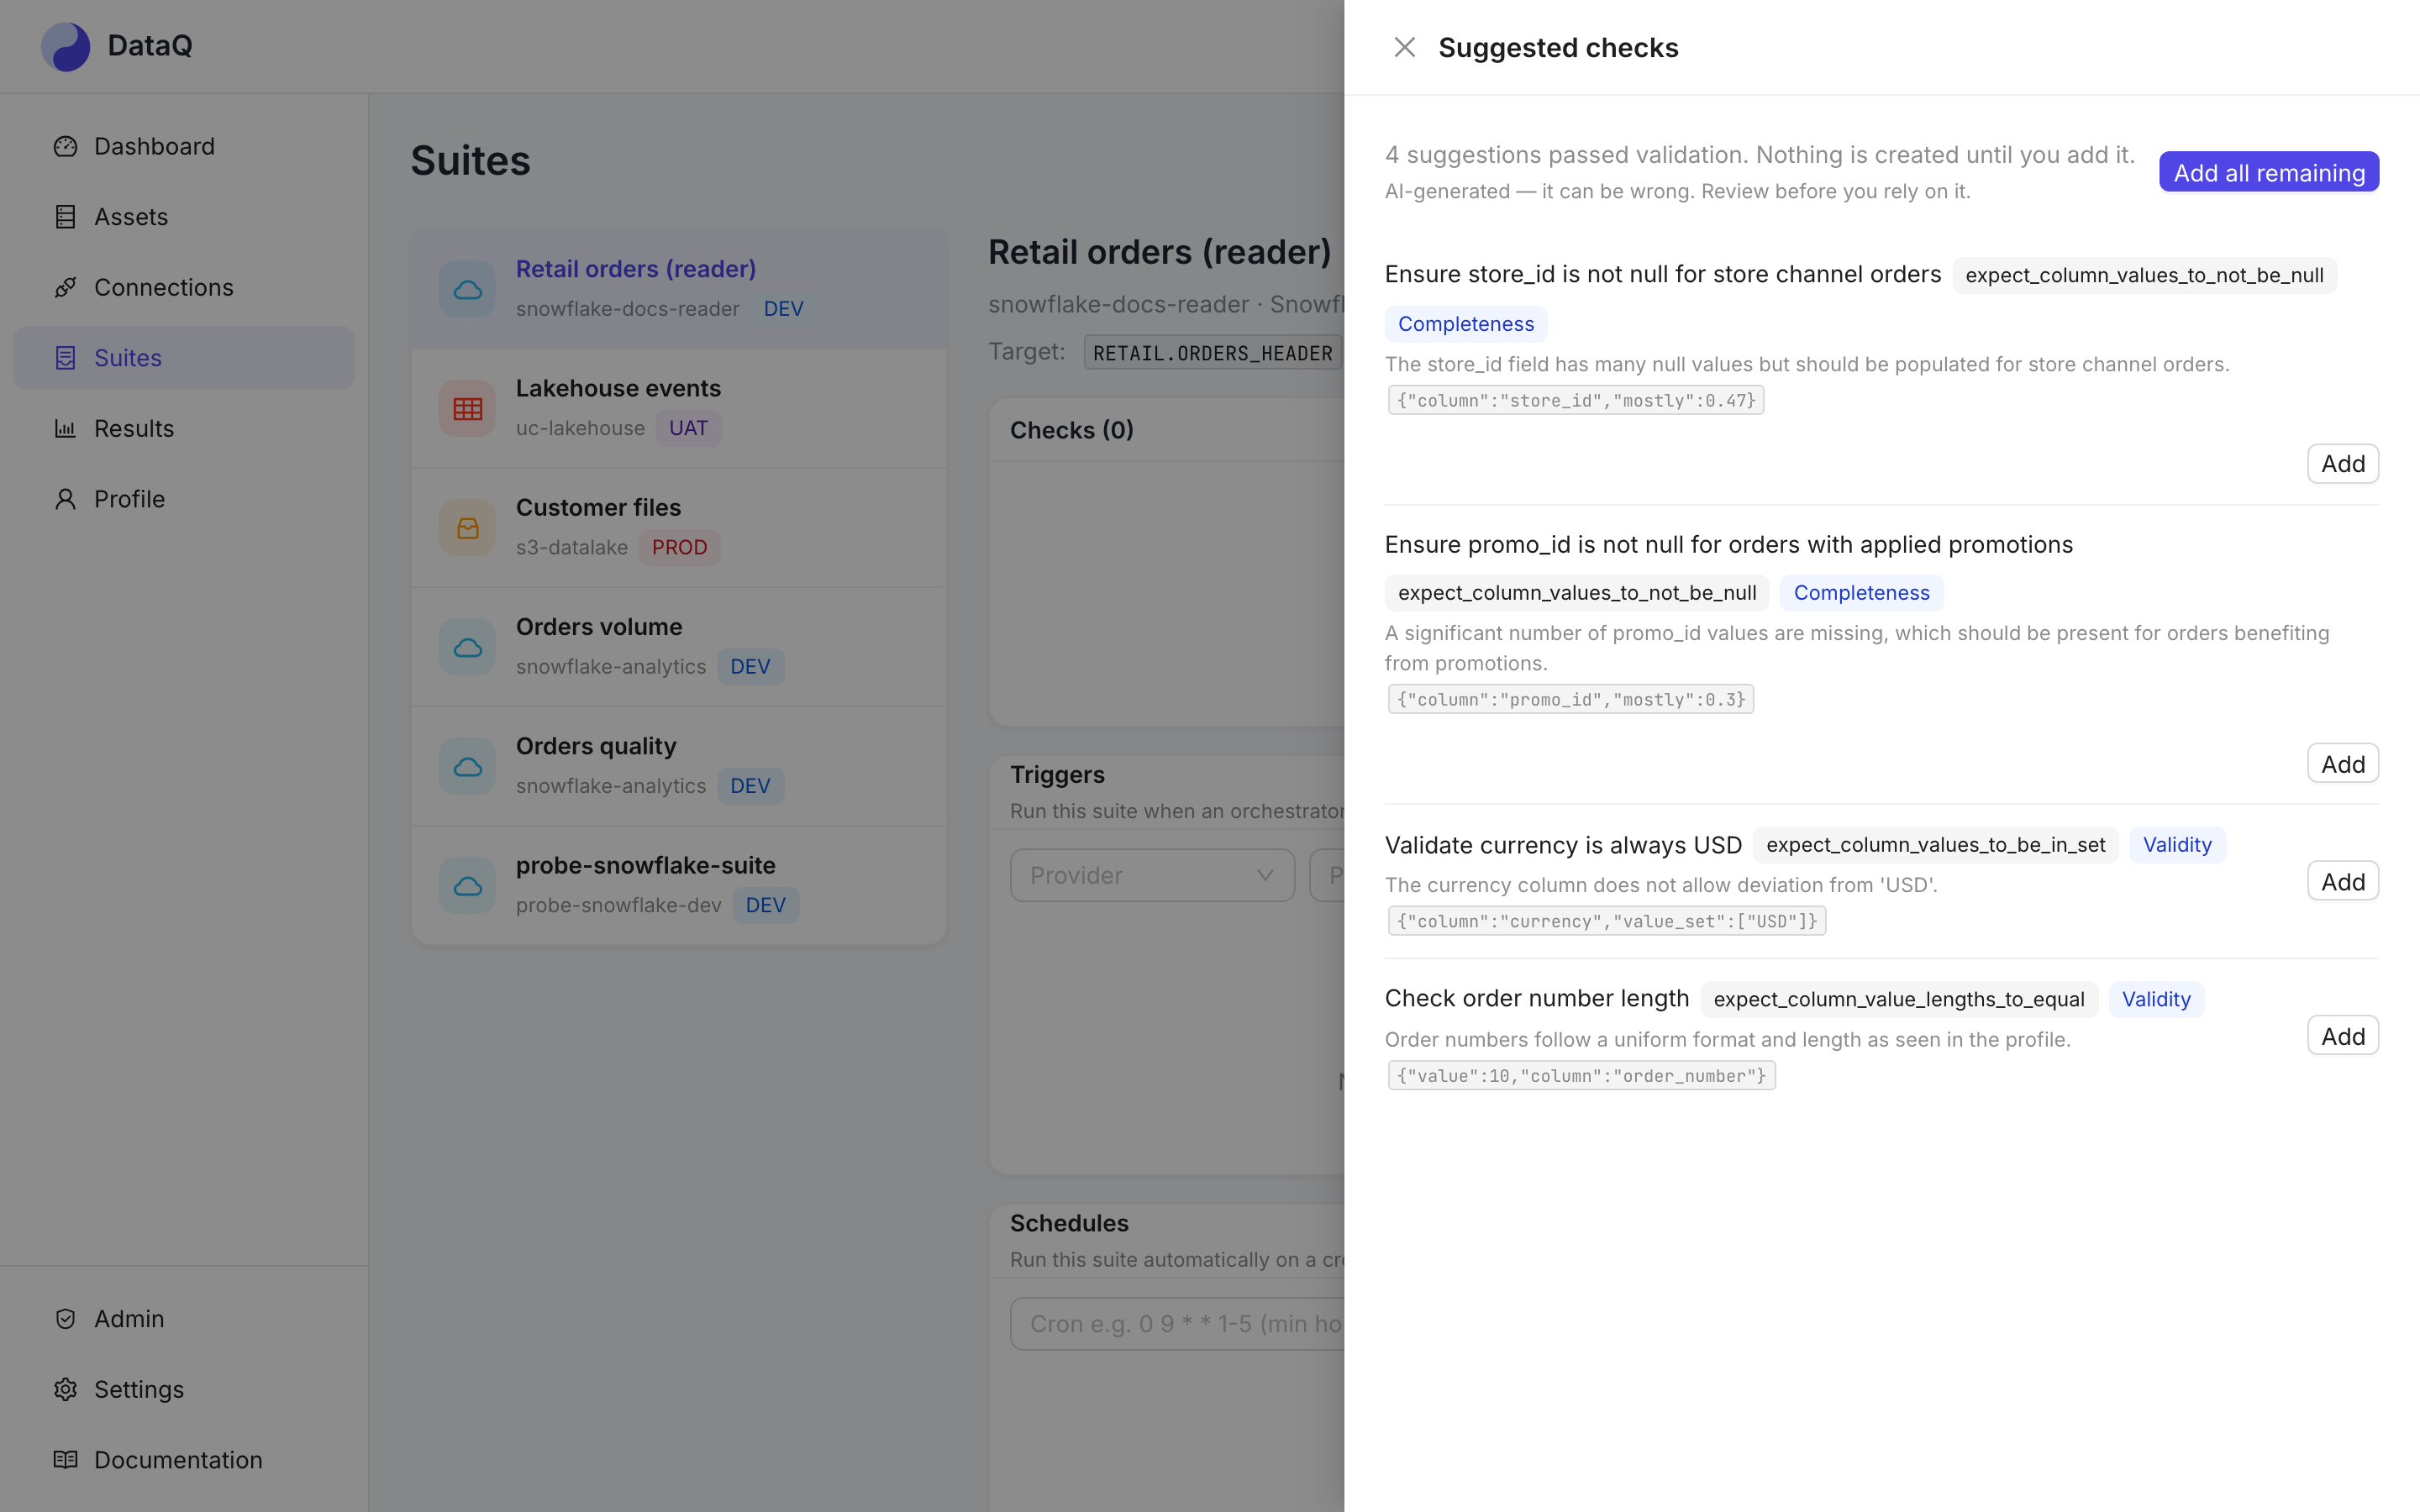
A freshness suggestion is offered only when the suite has an enabled pipeline trigger
binding, because its threshold is grounded in that pipeline's observed cadence, not in the
column profile. Every candidate goes through the same validator create_check uses — a
suggestion naming a column the table doesn't have is refused the same way a human's typo
would be — and one that fails is dropped and shown under a rejection warning, with the
reason; if all fail, the whole generation fails rather than returning nothing.
Suggestions are proposals: nothing is created until you click Add (or Add all
remaining), so one you disagree with costs a glance. A separate warning surfaces any
pipeline trigger binding that nearly matched this suite (right pipeline, wrong
environment) — a coverage gap no column profile could reveal either way.
Scripted / MCP access
curl -X POST https://<your-dataq-host>/api/v1/llm/check_suggestions \
  -H "Authorization: Bearer dq_live_…" -H "Content-Type: application/json" \
  -d '{"suite_id": "<suite id>"}'
{suggestions, rejected, coverage_warnings} — each suggestion carries
expectation_type, name, rationale, config and dimension (plus
fail_threshold_hours instead of a threshold inside config for a freshness
suggestion).
What is recorded, what it costs, who may call
- Every call is a row in
llm_invocations— kind, requester, suite, token counts, duration, the validated response or the reason it failed. The Admin Test probe is recorded too. Your own invocations are readable by you; all of them by an Admin. - Permissions follow the suite. SQL generation and check suggestions need
editon the suite; the narrative needsviewon the incident's suite. There is no LLM tool over MCP and no Admin-only feature — an assistant holding your token can do exactly what you can. - Rate-limited under its own class, separate from the REST ceiling, so a burst of generations cannot crowd out normal API traffic — and vice-versa.
- Off is really off. With the switch disabled, all three endpoints return an LLM not configured error and nothing is sent anywhere — the worker re-checks the switch before every call, so disabling it mid-flight fails the queued generation too.
Design record: ADR 0042.