Concepts
Six words carry the whole product. Here they are, in the order you meet them.
flowchart LR
    C[Connection] --> S[Suite]
    S --> K[Checks]
    K --> R[Run]
    R --> T[Results]
    T --> A[Alerts & incidents]
    P[Pipeline] -. triggers .-> R
style P stroke-dasharray: 4 4| Word | Plain English | Where you see it |
|---|---|---|
| Connection | How DataQ reaches one datasource (or one orchestrator), with its credential kept in the secret store | Connections |
| Suite | A named set of checks against one target table or file | Suites |
| Check | One rule: a value expectation, a monitor (freshness, volume, schema drift, anomaly), a comparison, or custom SQL | Suite → Checks |
| Run | One execution of a suite: manual, scheduled, or triggered by a pipeline | Results |
| Result | What each check found: pass · warn · fail · critical, plus the number it measured | Run detail |
| Incident | A critical breach anchored to the asset it hit, with evidence, until someone resolves it | Dashboard, Assets |
The one distinction: datasource vs orchestration
- Datasources are stores you write data-quality checks against: Snowflake, ADLS Gen2, AWS S3 (or any S3-compatible store — MinIO, Ceph, R2, Wasabi, Backblaze), Unity Catalog (Databricks), Apache Iceberg (native read).
- Orchestration providers are workflow engines DataQ observes — Azure Data Factory (ADF), Apache Airflow, and dbt. DataQ does three things with them: monitor pipeline/DAG/build runs, detect failures in near-real-time, and trigger a check suite when a pipeline finishes successfully. They are not datasources — you never write checks against ADF/Airflow/dbt.
Note
This split is load-bearing throughout the product. Orchestration runs live in
pipeline_runs; data-quality runs live in runs. They're linked, never conflated.
Core objects
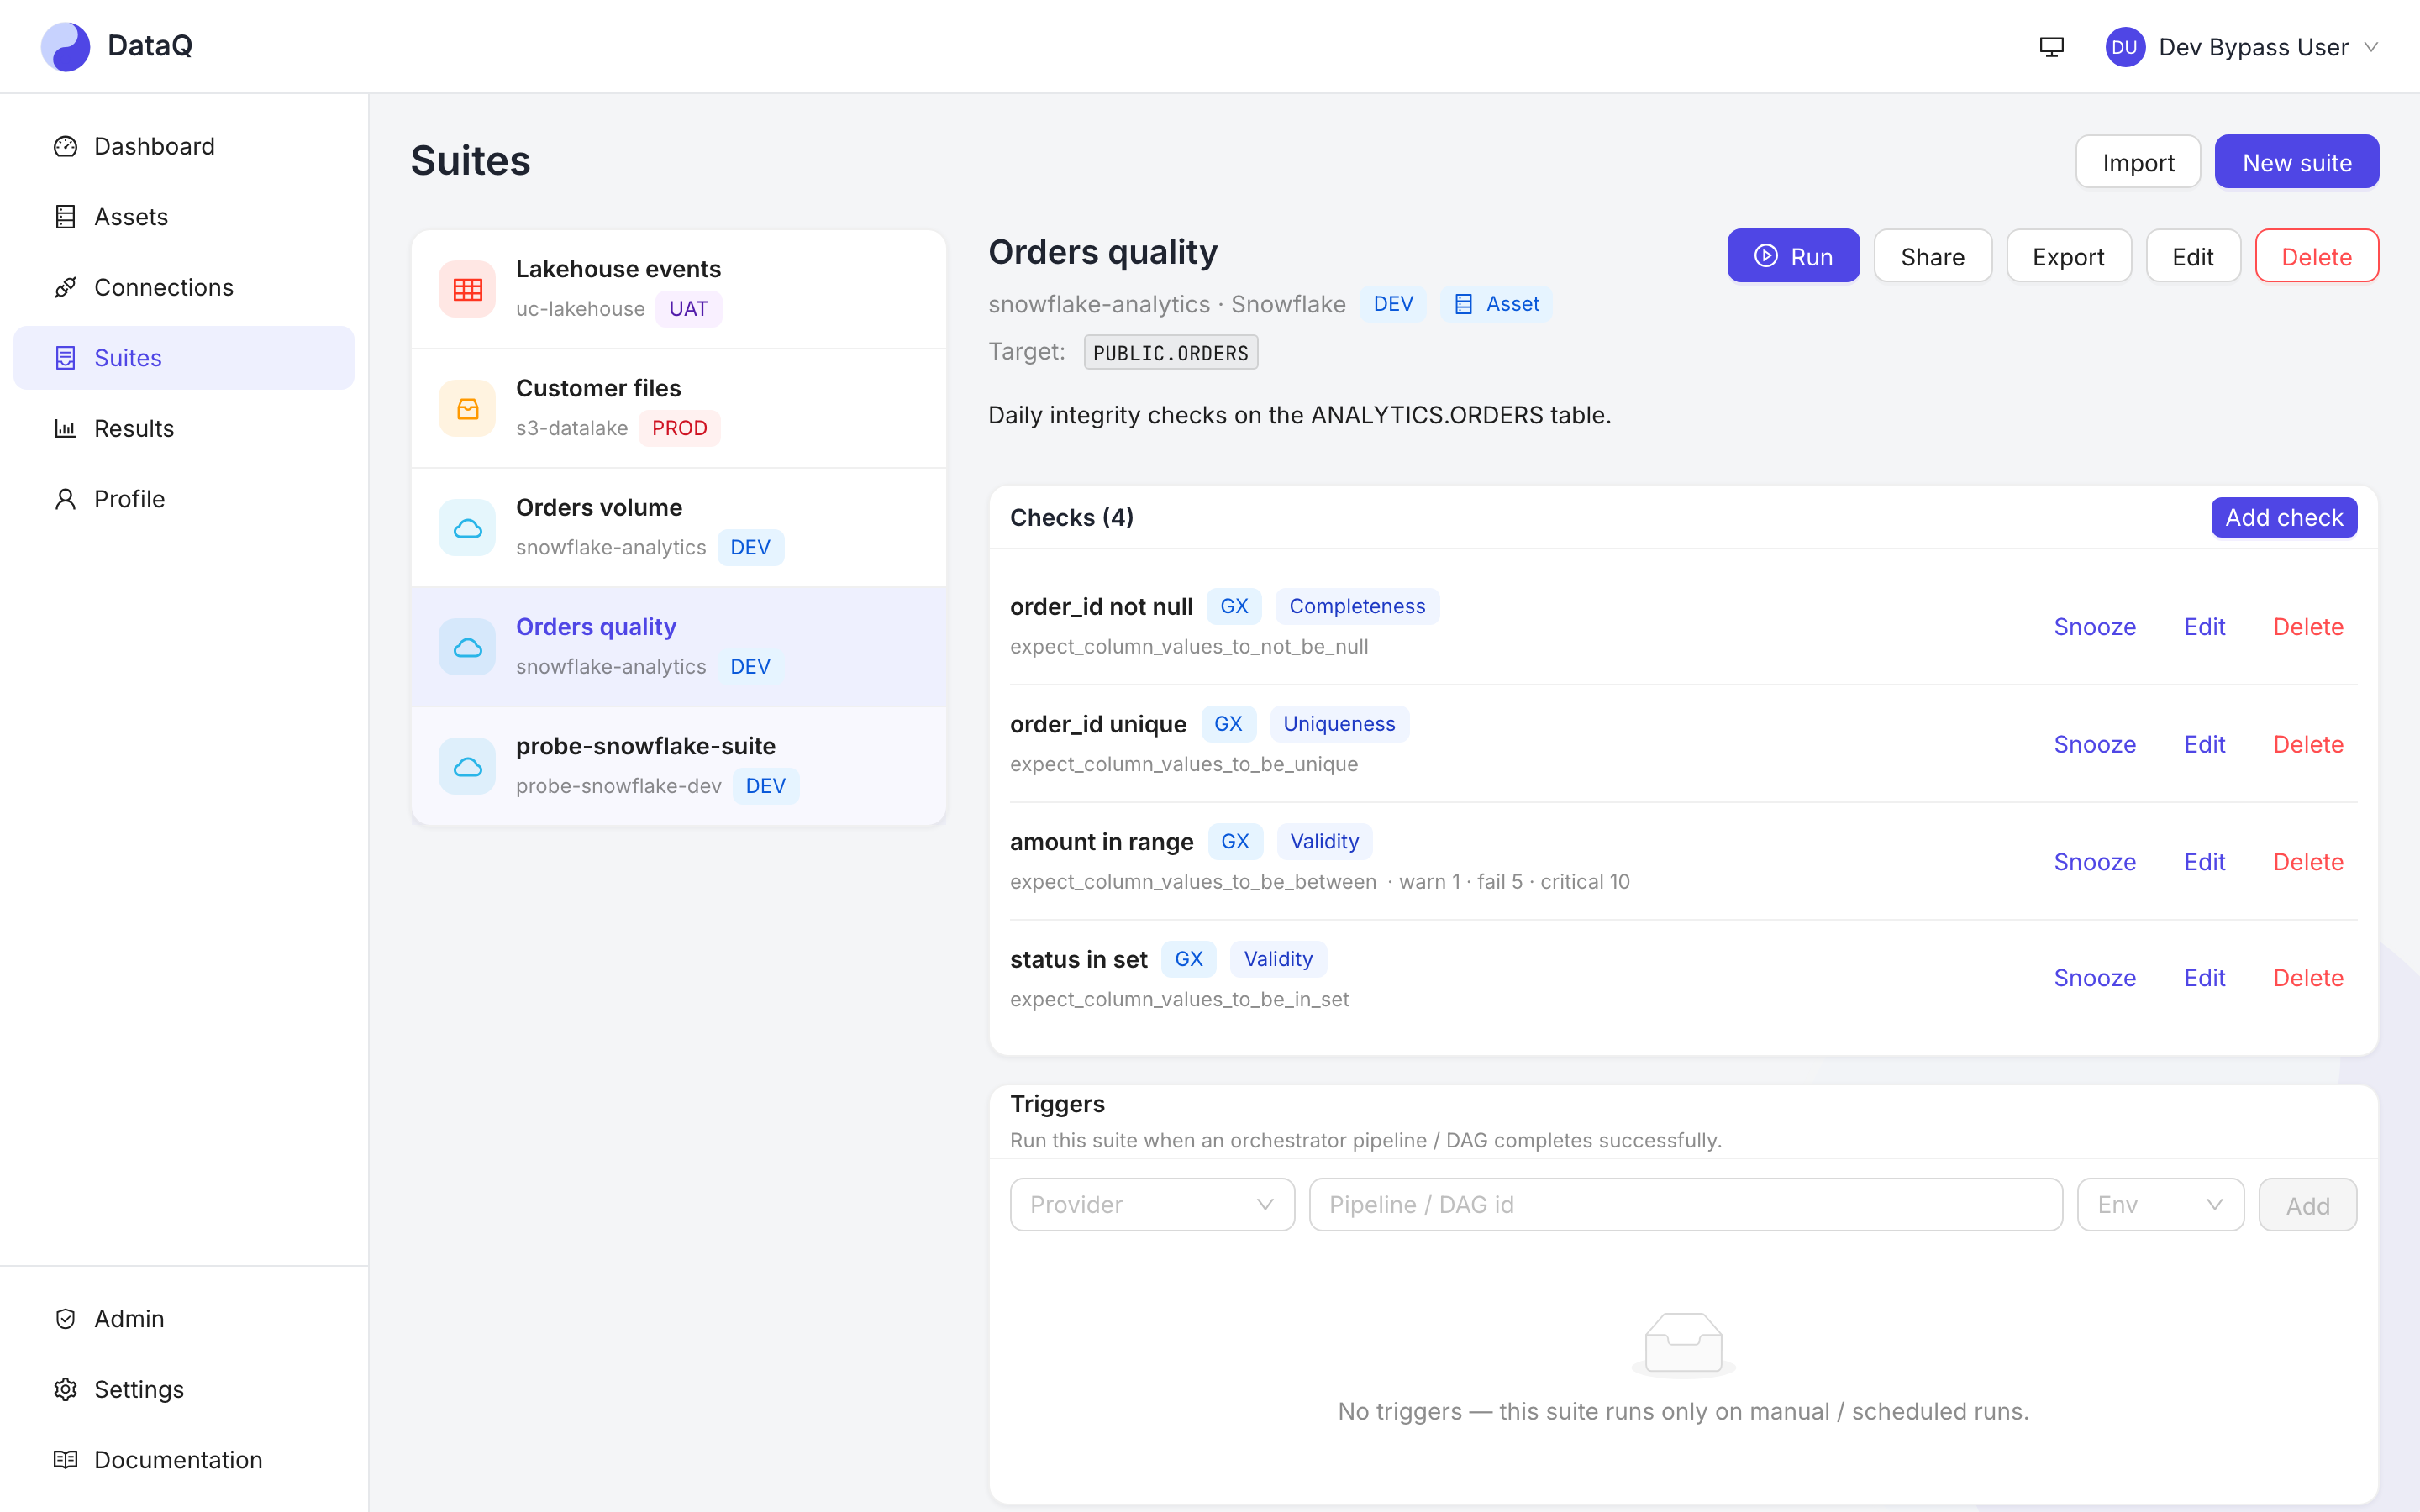
- Connection — credentials + config for one datasource or orchestration provider.
- Suite — a named collection of checks that runs against one connection's target
(a table, a file/path, a Unity Catalog table, or an Iceberg
namespace.table). - Check — a single data-quality rule. Six kinds: a Great Expectations expectation (e.g. "this column is never null", or a custom SQL rule), or one of the monitor kinds — freshness (is the data stale?), volume (did the load land whole?), schema drift (did the shape change?), anomaly (is this value abnormal for this dataset?), and comparison (does it reconcile against a baseline dataset?).
- Run — one execution of a suite. Each check produces a result with a status: pass / warn / fail / critical (plus skip / error for operational outcomes).
- Severity & health score — warn/fail/critical are weighted into a workspace health score and trend so you can see quality moving over time.
How a check runs
You author a suite → run it manually, on a schedule, or triggered by a pipeline → a Celery worker executes the checks via Great Expectations against the datasource → results are stored, the health score updates, and alerts fire (Teams / Slack / email) for failures. See Architecture for the flow.