Tutorial — your first suite
A hands-on walkthrough: from an empty workspace to a check that runs and alerts, in a few minutes. It assumes DataQ is already running and you can sign in (if you're standing up the app itself, see Getting started and Deployment first).
By the end you'll have connected a datasource, authored a suite with a freshness + a value check, run it, read the result, and wired an alert.
0. Sign in
Open the app URL and sign in — the local/eval stack defaults to an email one-time code
(check the bundled Mailpit inbox at http://localhost:8025); a production deployment
typically uses your identity provider (SSO). See
Getting started for the three sign-in modes. You land on
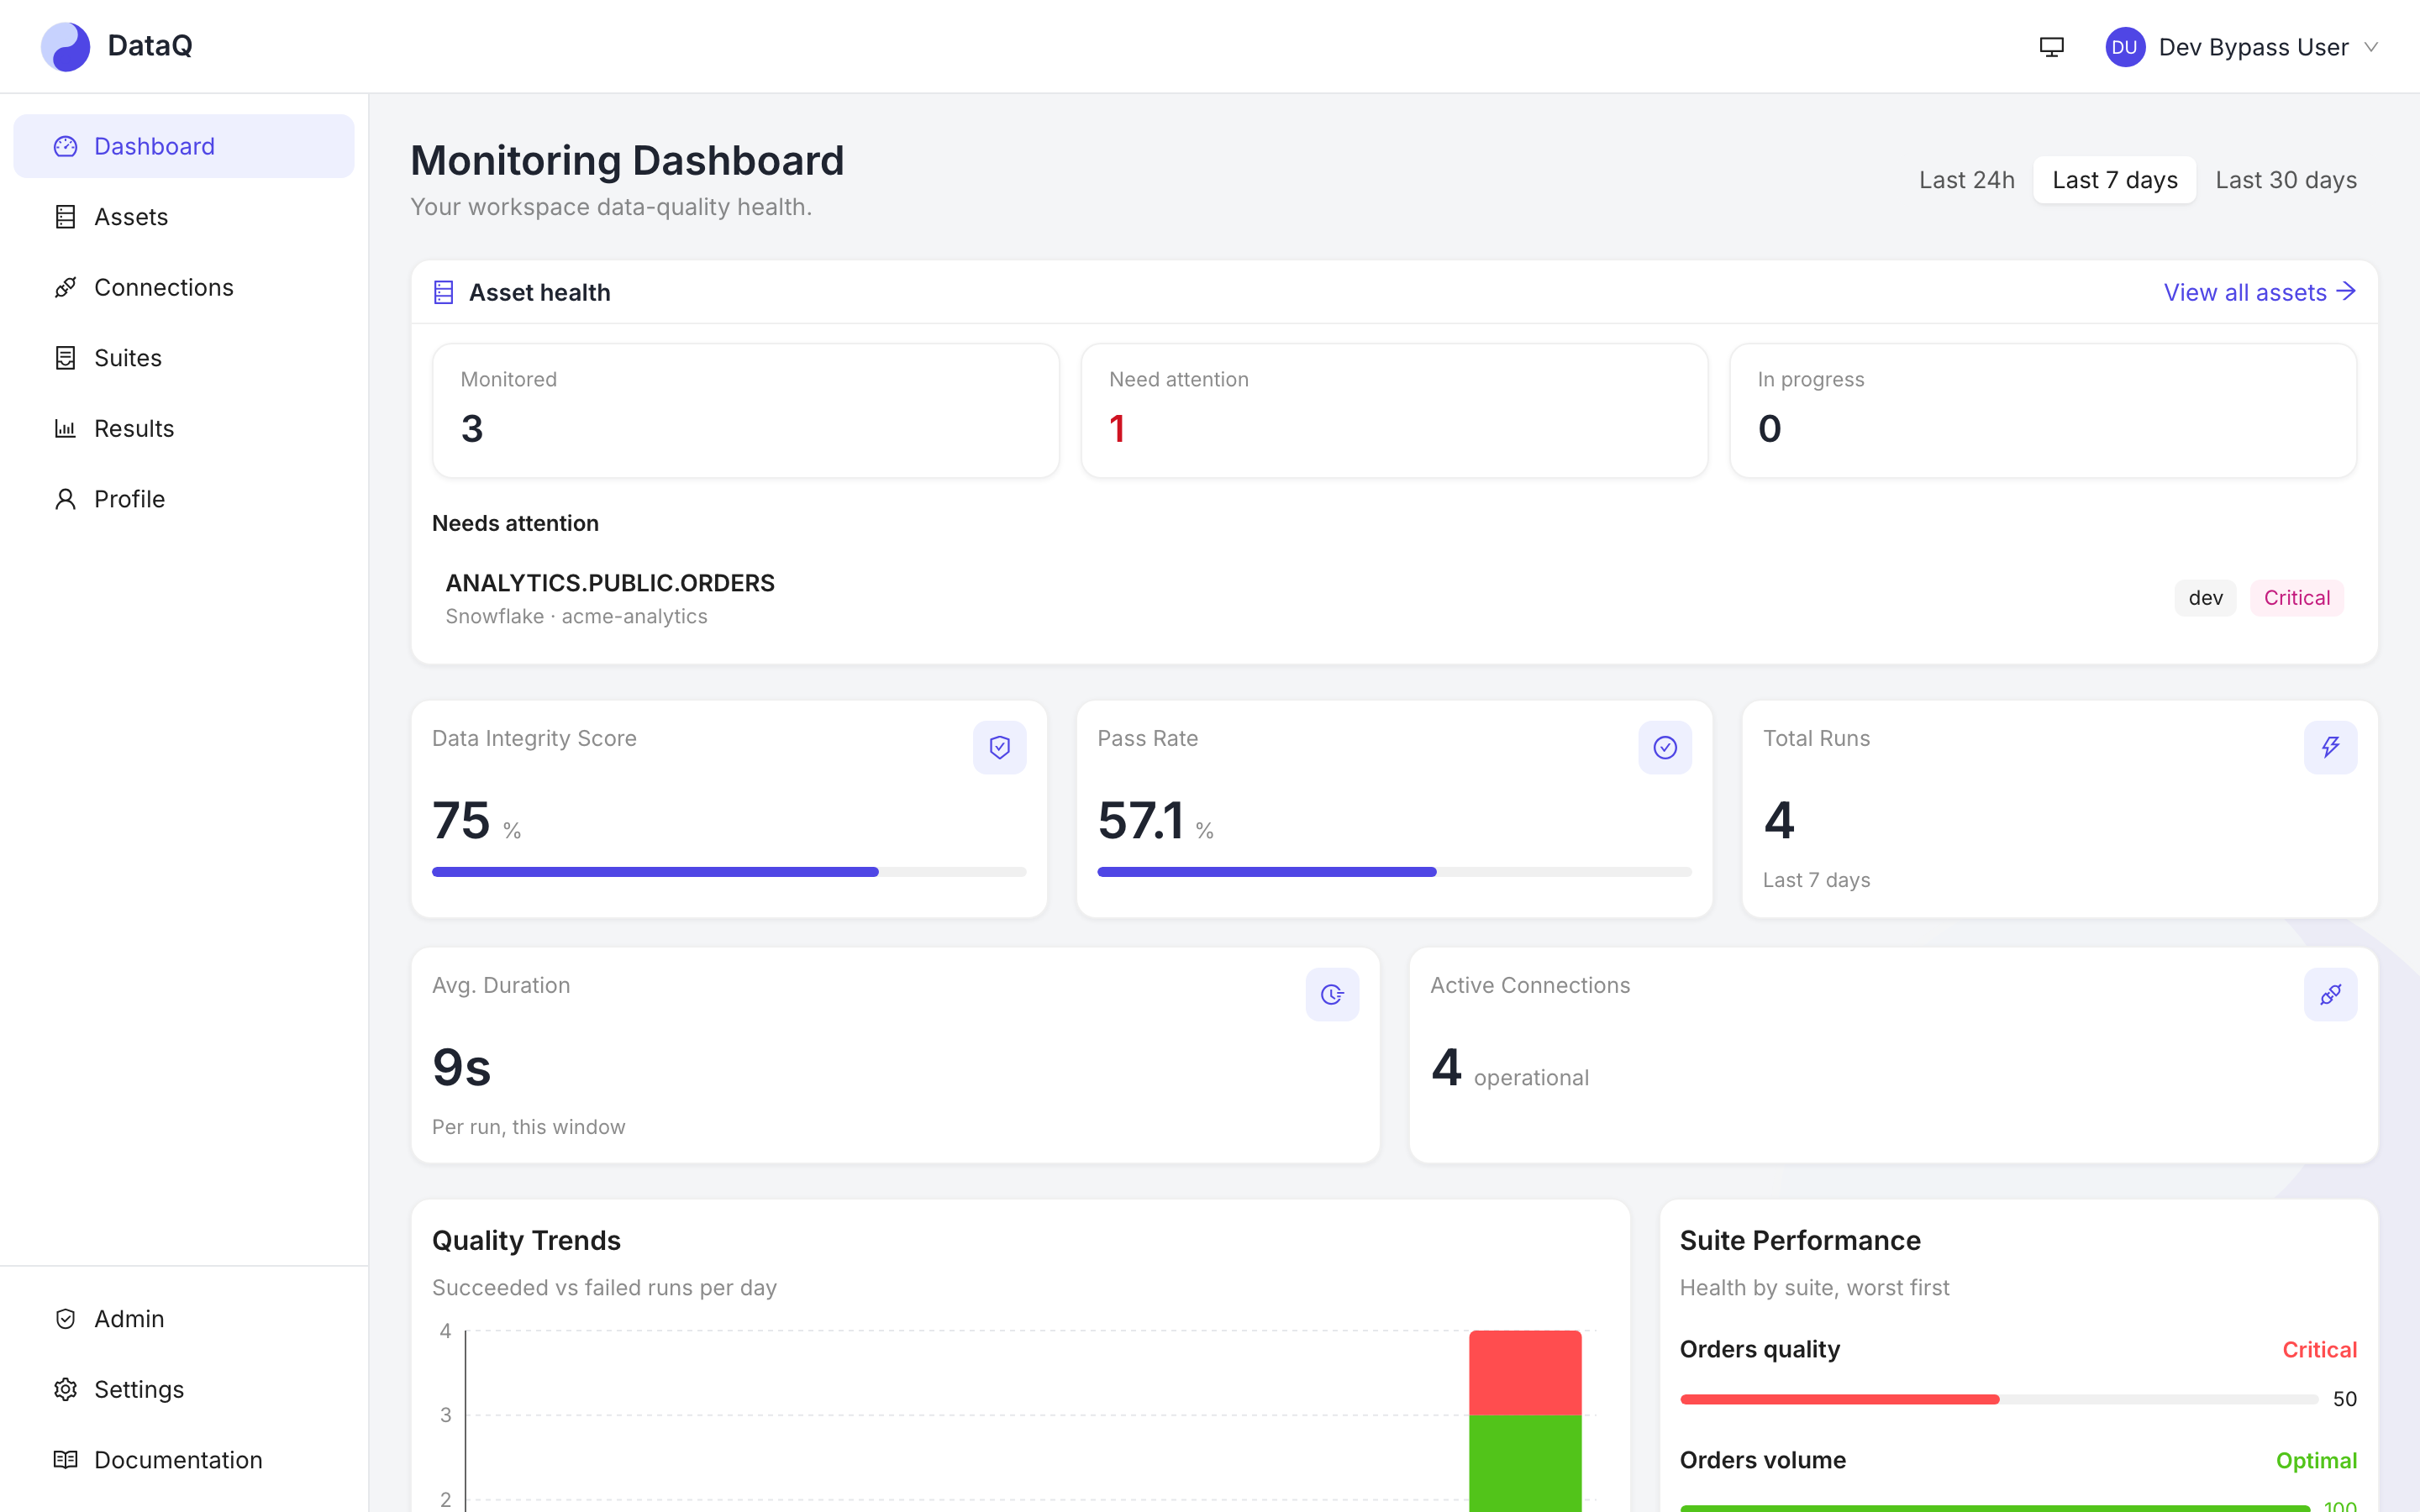
the Dashboard — empty for now. Once suites have run it looks like this:
1. Connect a datasource
This step needs the Admin role. Connections are shared infrastructure holding credentials, so only workspace Admins can create, edit, delete, or re-credential one (ADR 0033). If you're a Member or Viewer, ask an Admin to set the connection up — then pick this tutorial back up at step 2.
-
Go to Connections → Add connection.
Adding a Snowflake connection, start to finish (12 s)
-
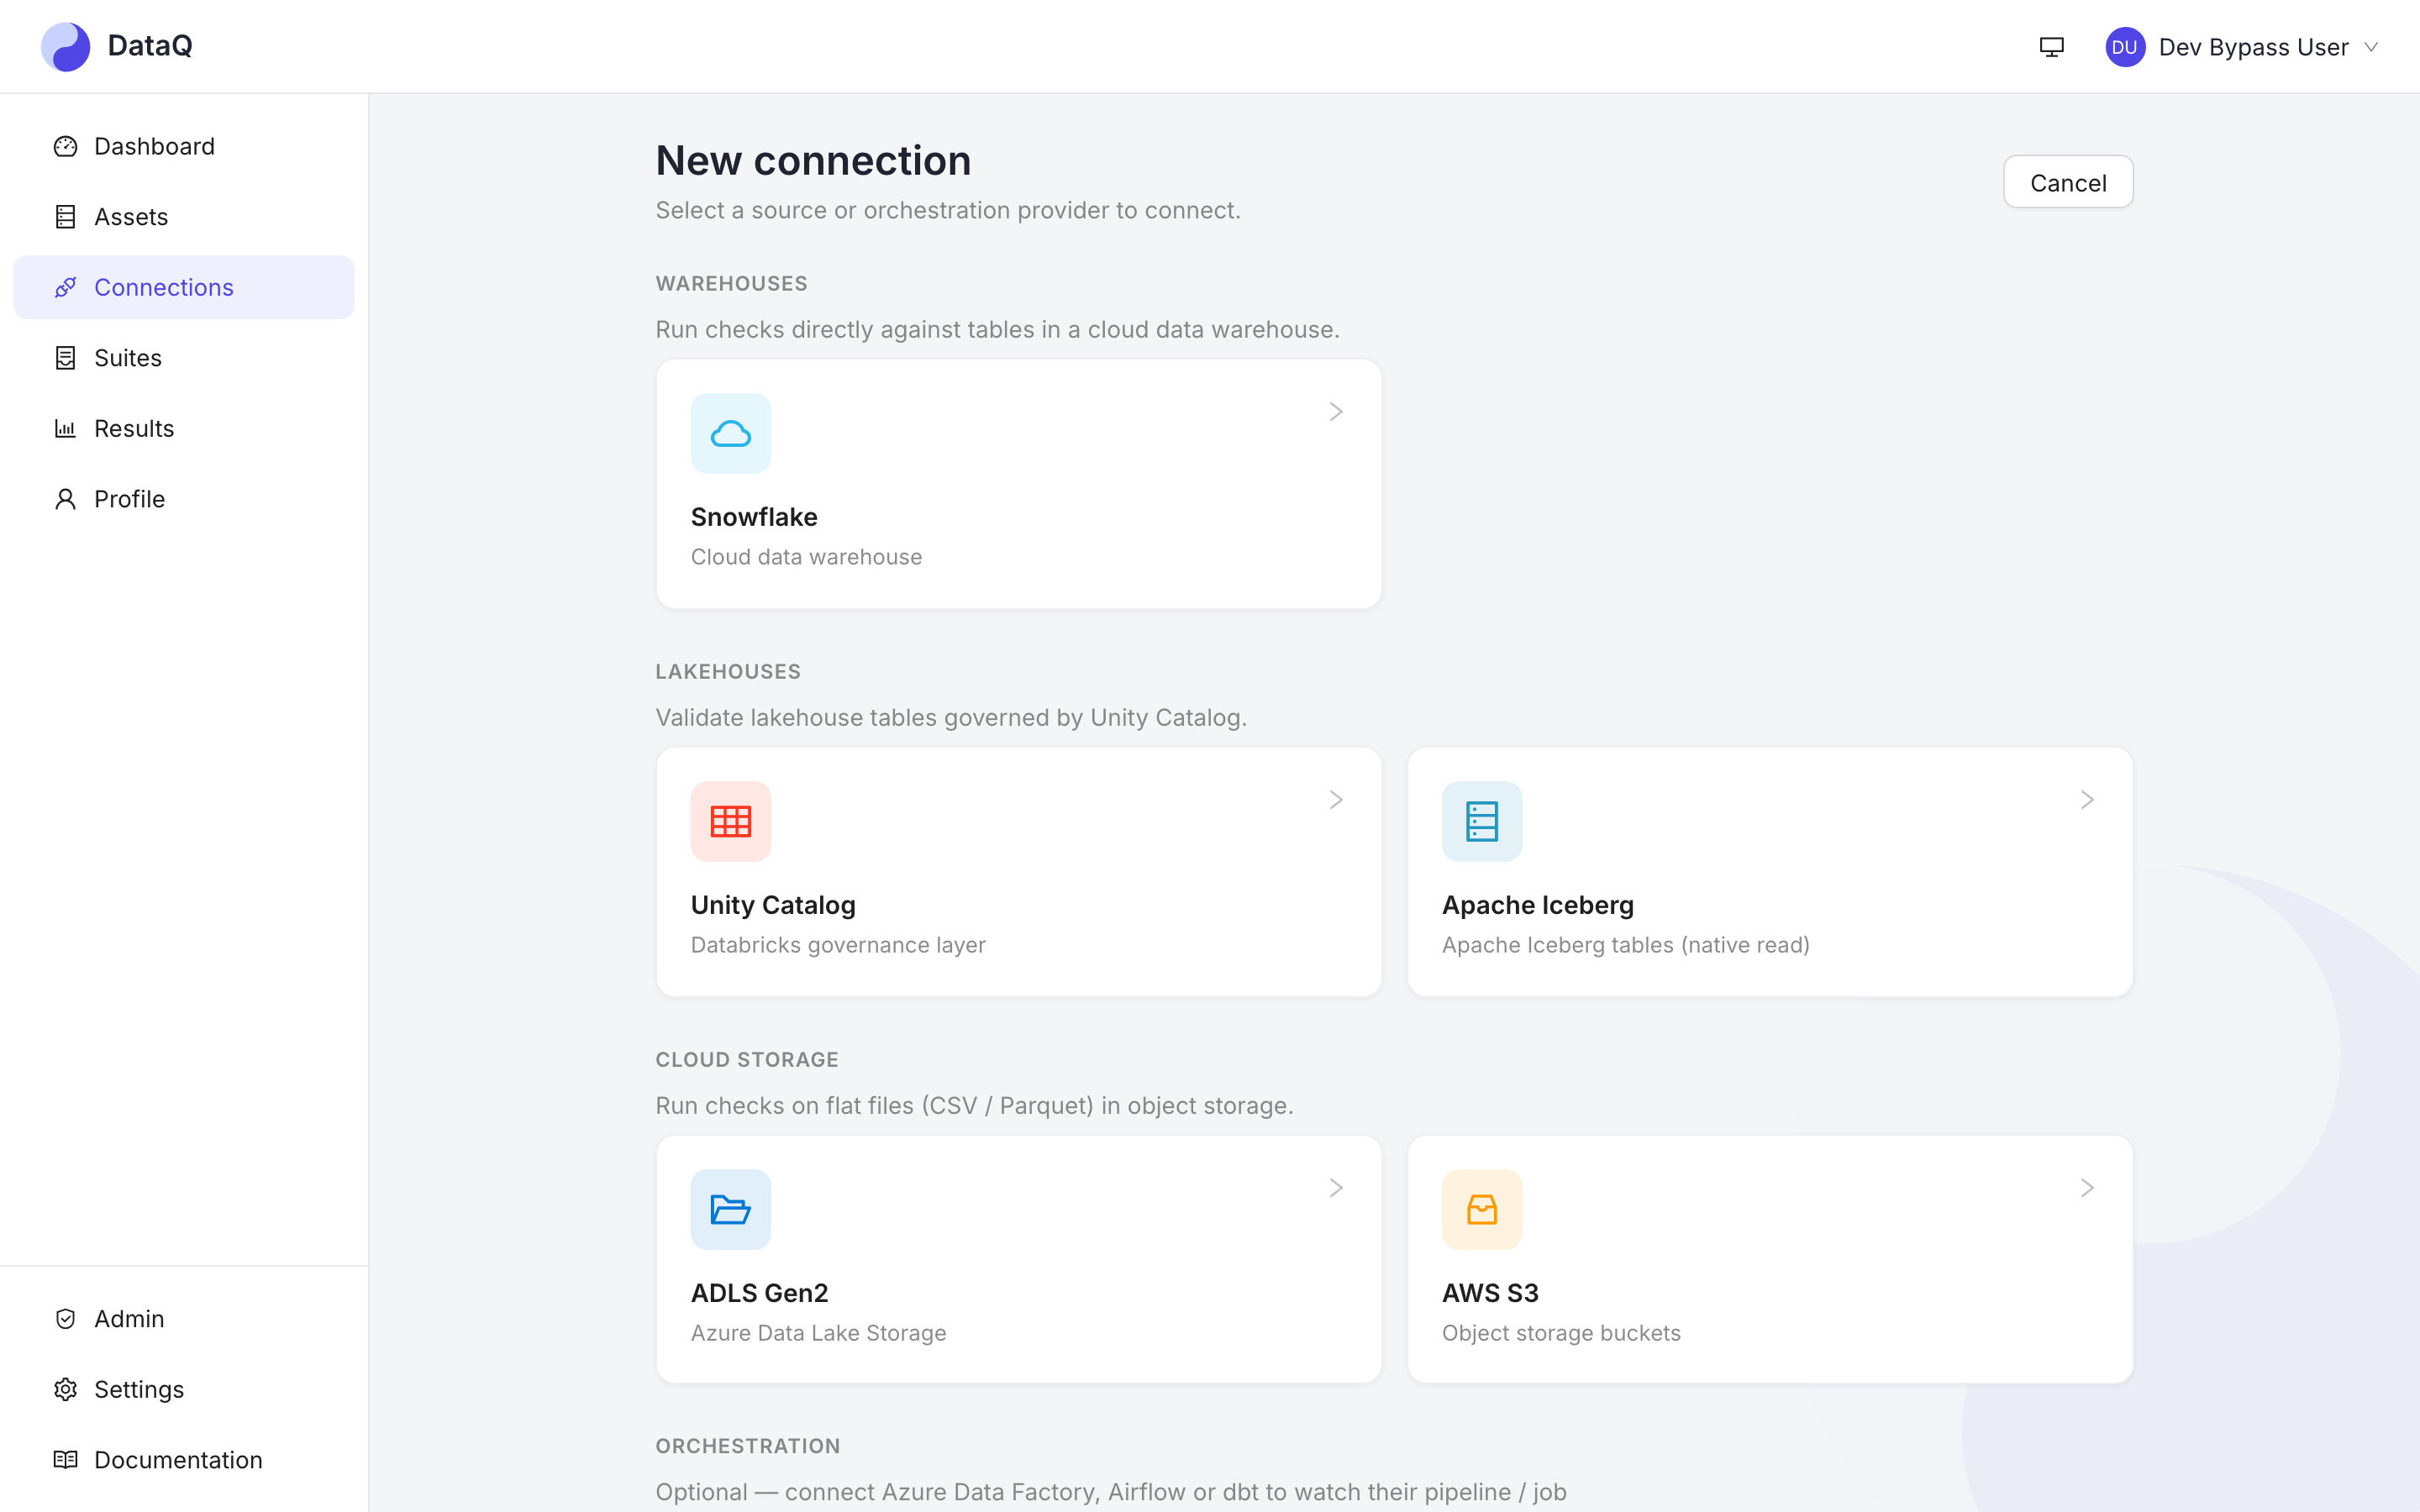
Pick your datasource type (Snowflake, Unity Catalog, ADLS Gen2, S3, or Apache Iceberg). The form is spec-driven — it asks only for what that type needs.
-
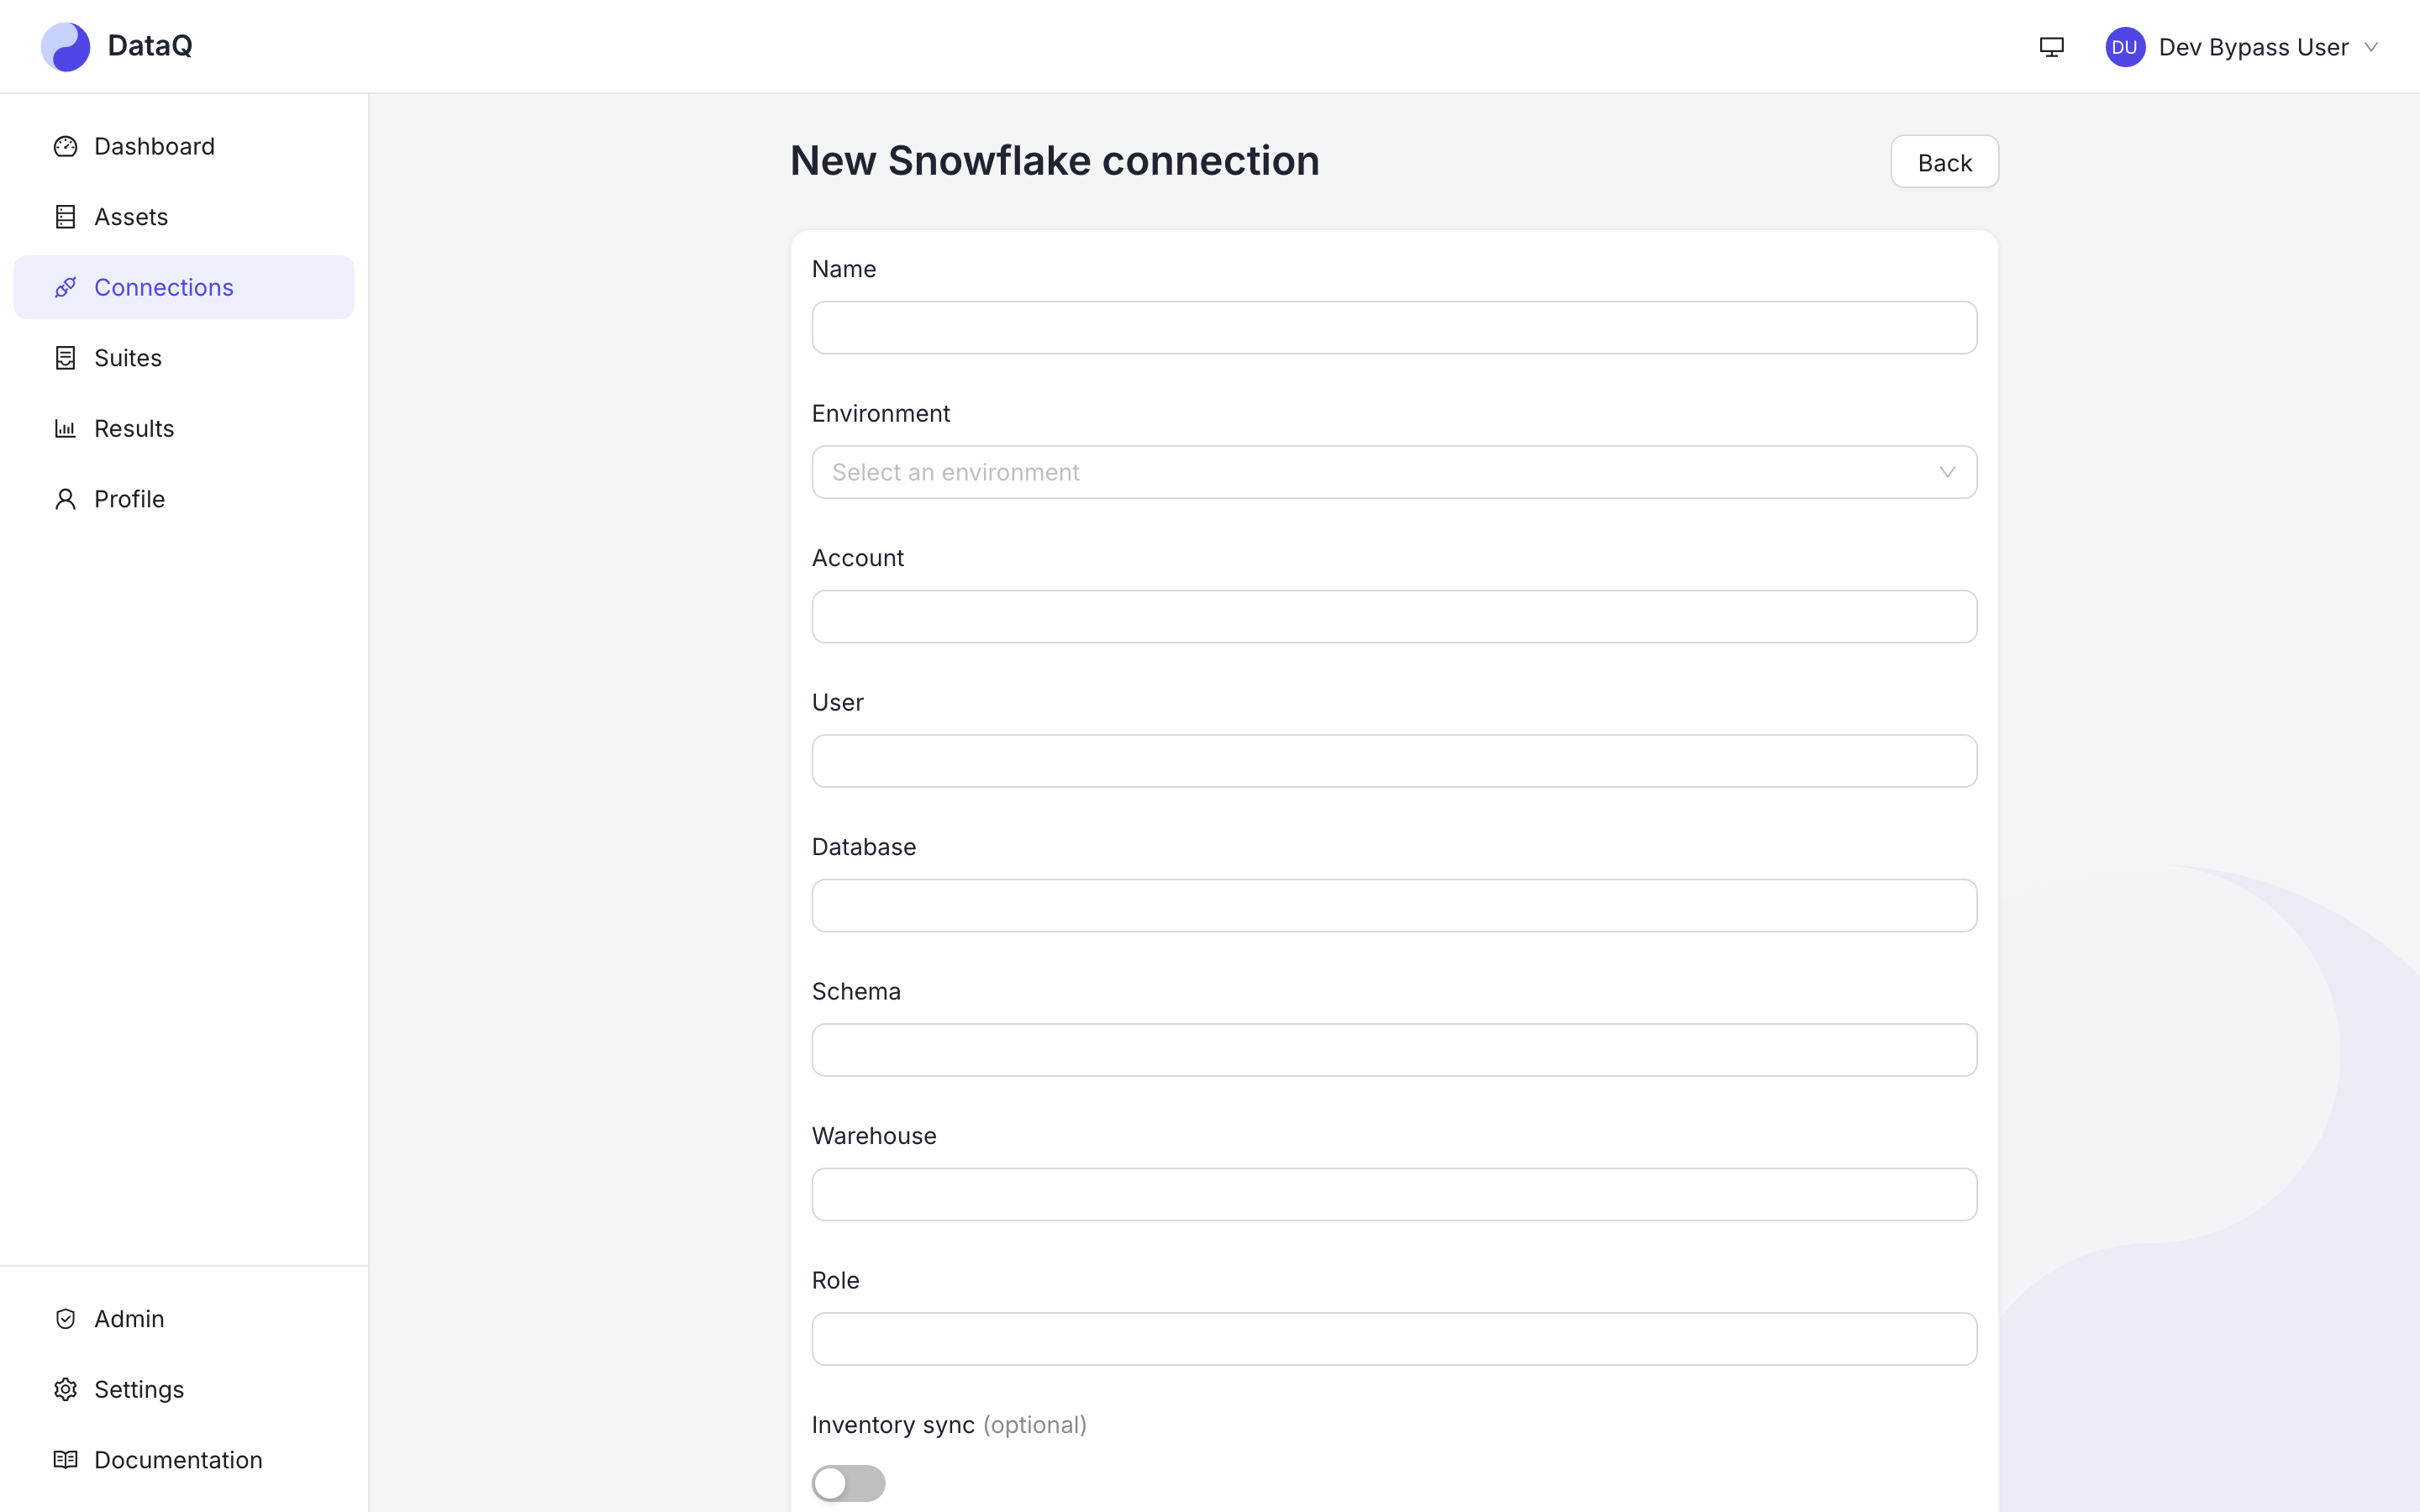
Fill it in with a read-only credential (for Snowflake, key-pair auth is recommended), then click Test. A green result means DataQ can reach it.
Tip: name it for its environment — e.g. snowflake-prod — so a suite's env is unambiguous.
Later: moving an existing connection to a different host — a new Snowflake account, a new
endpoint_url — requires re-entering the credential in the same save. The form asks for it as
soon as you change one of those fields; a stored credential is never sent to a destination you
changed without it.
2. Create a suite and point it at a target
-
Go to Suites → New suite, give it a name (e.g.
orders — snowflake prod), and pick the connection you just made. -
Set the run target: a table (SQL datasources) or a file / batch pattern (flat files).
-
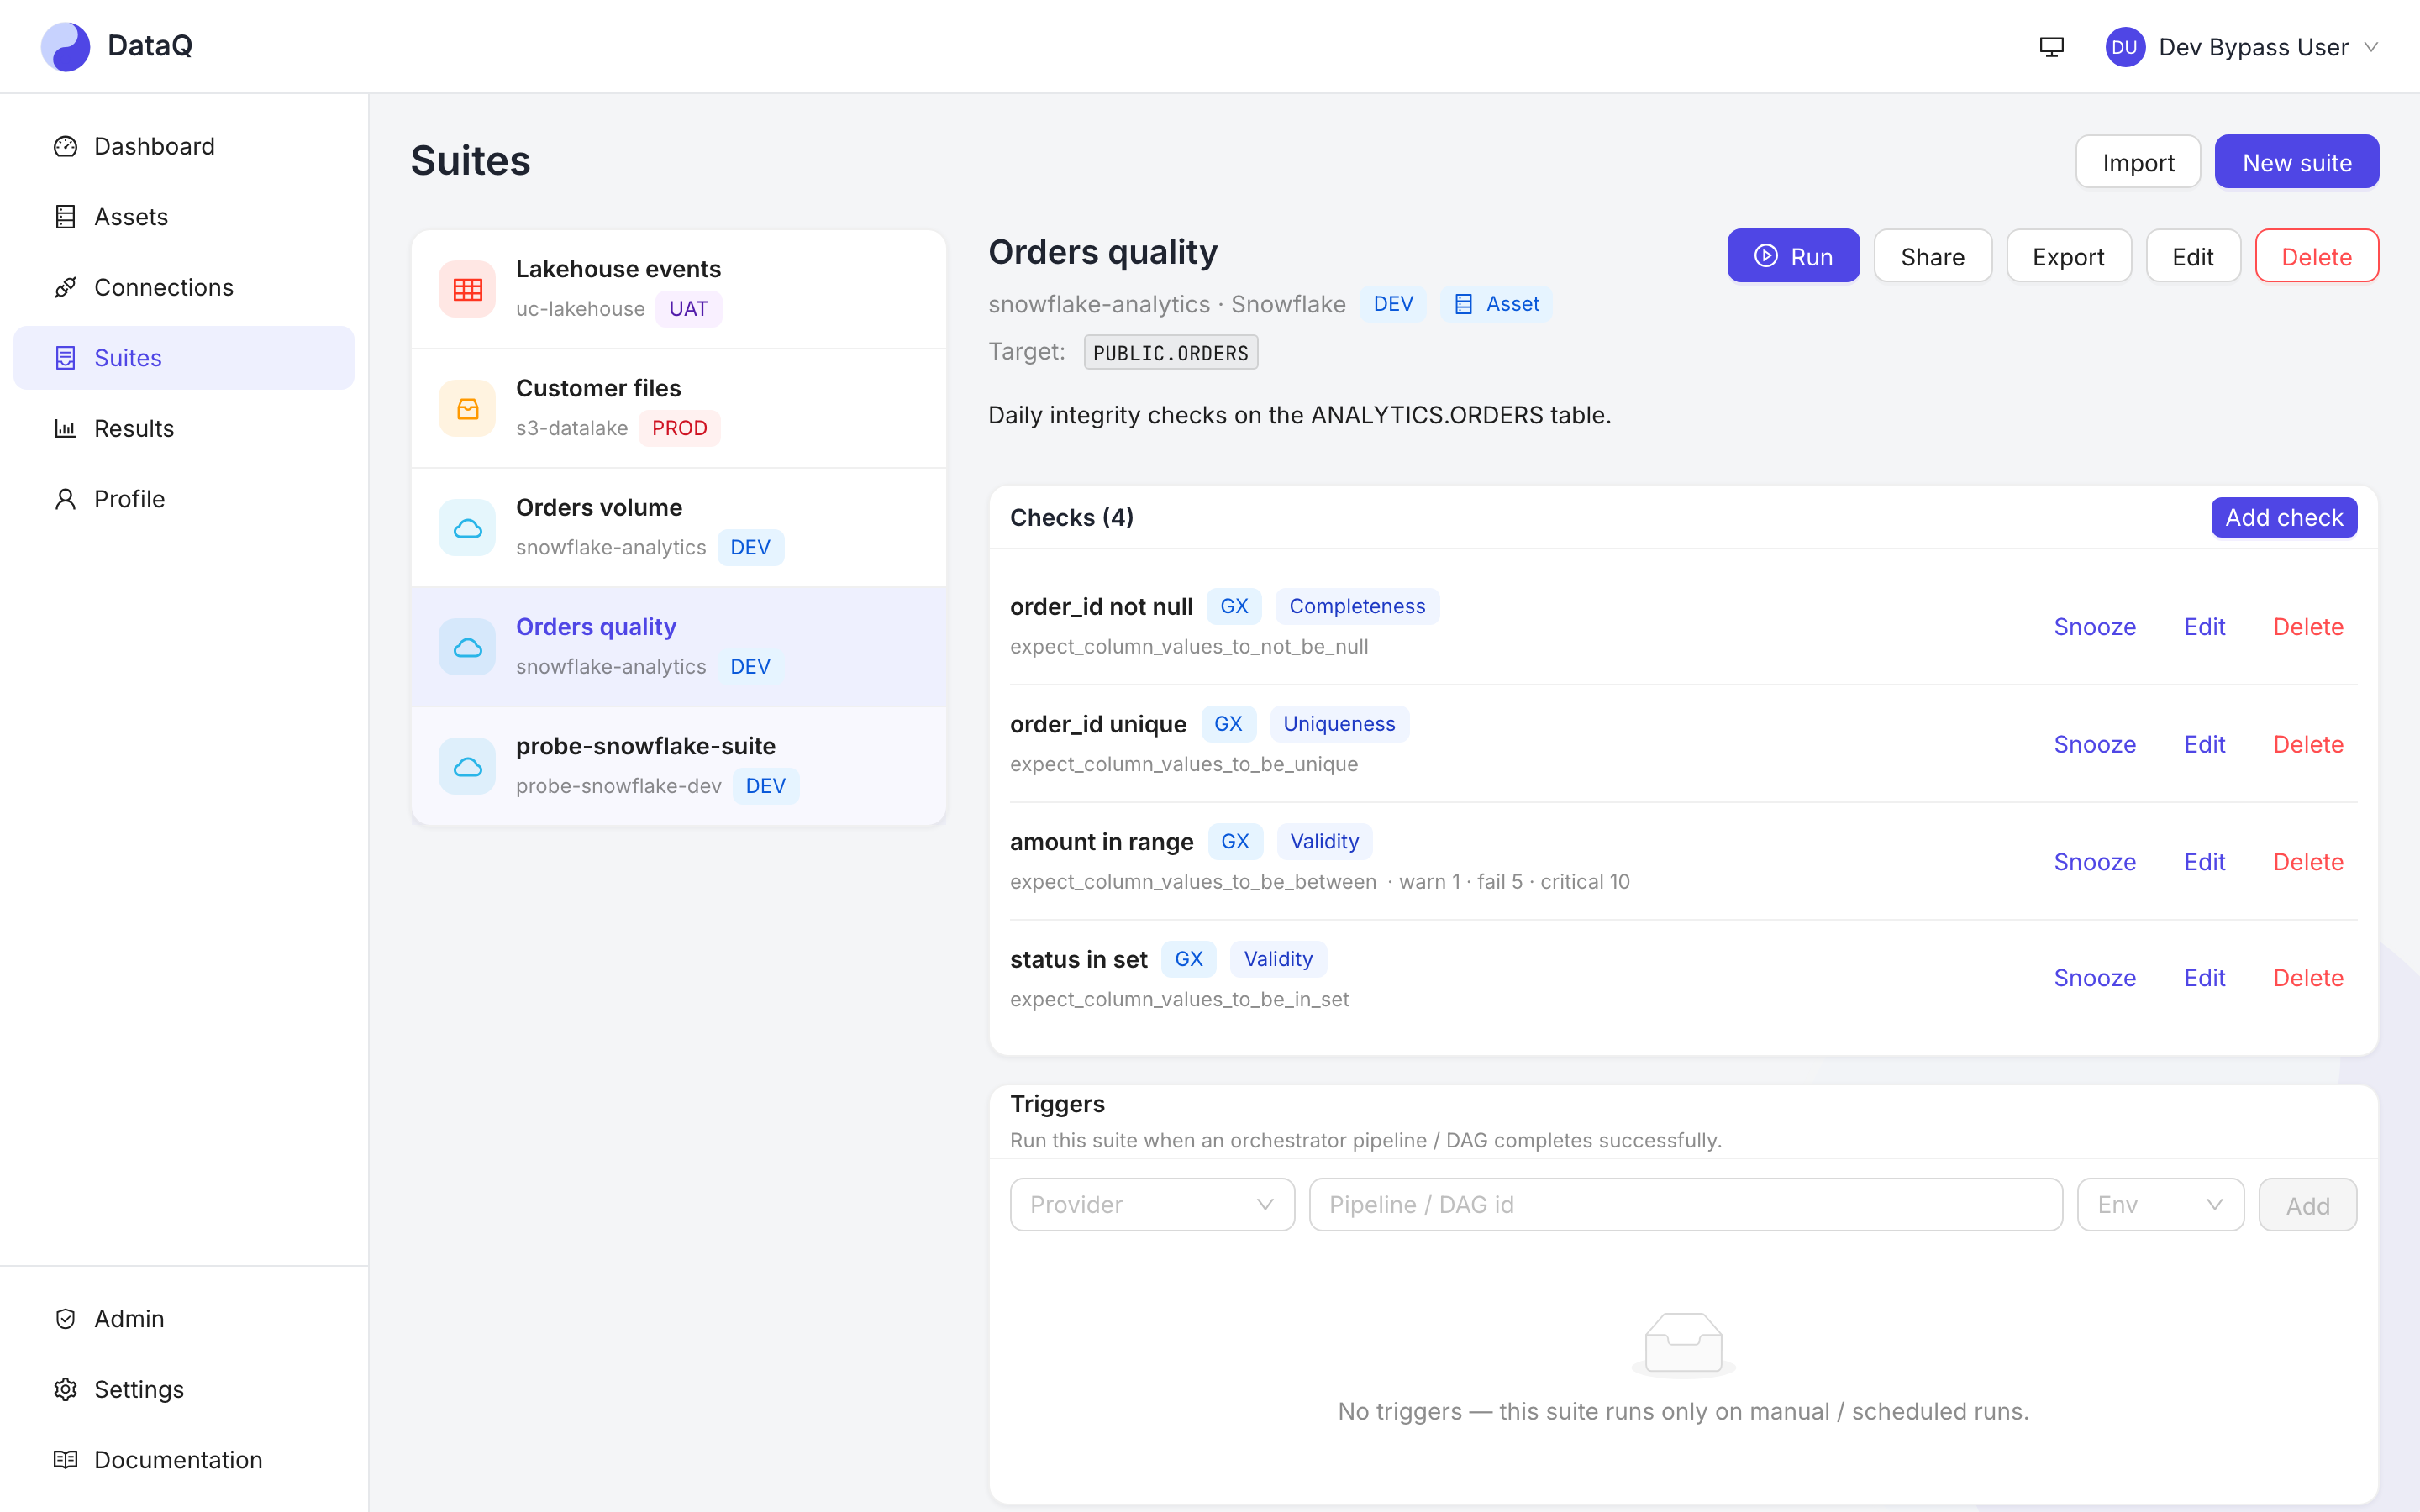
Save. The suite is empty — let's add checks. A finished suite looks like this:
3. Add your first checks
Start with the checks that catch the incidents that actually page people — "did the load run?" and "did it land whole?" — before any value-level rule.
-
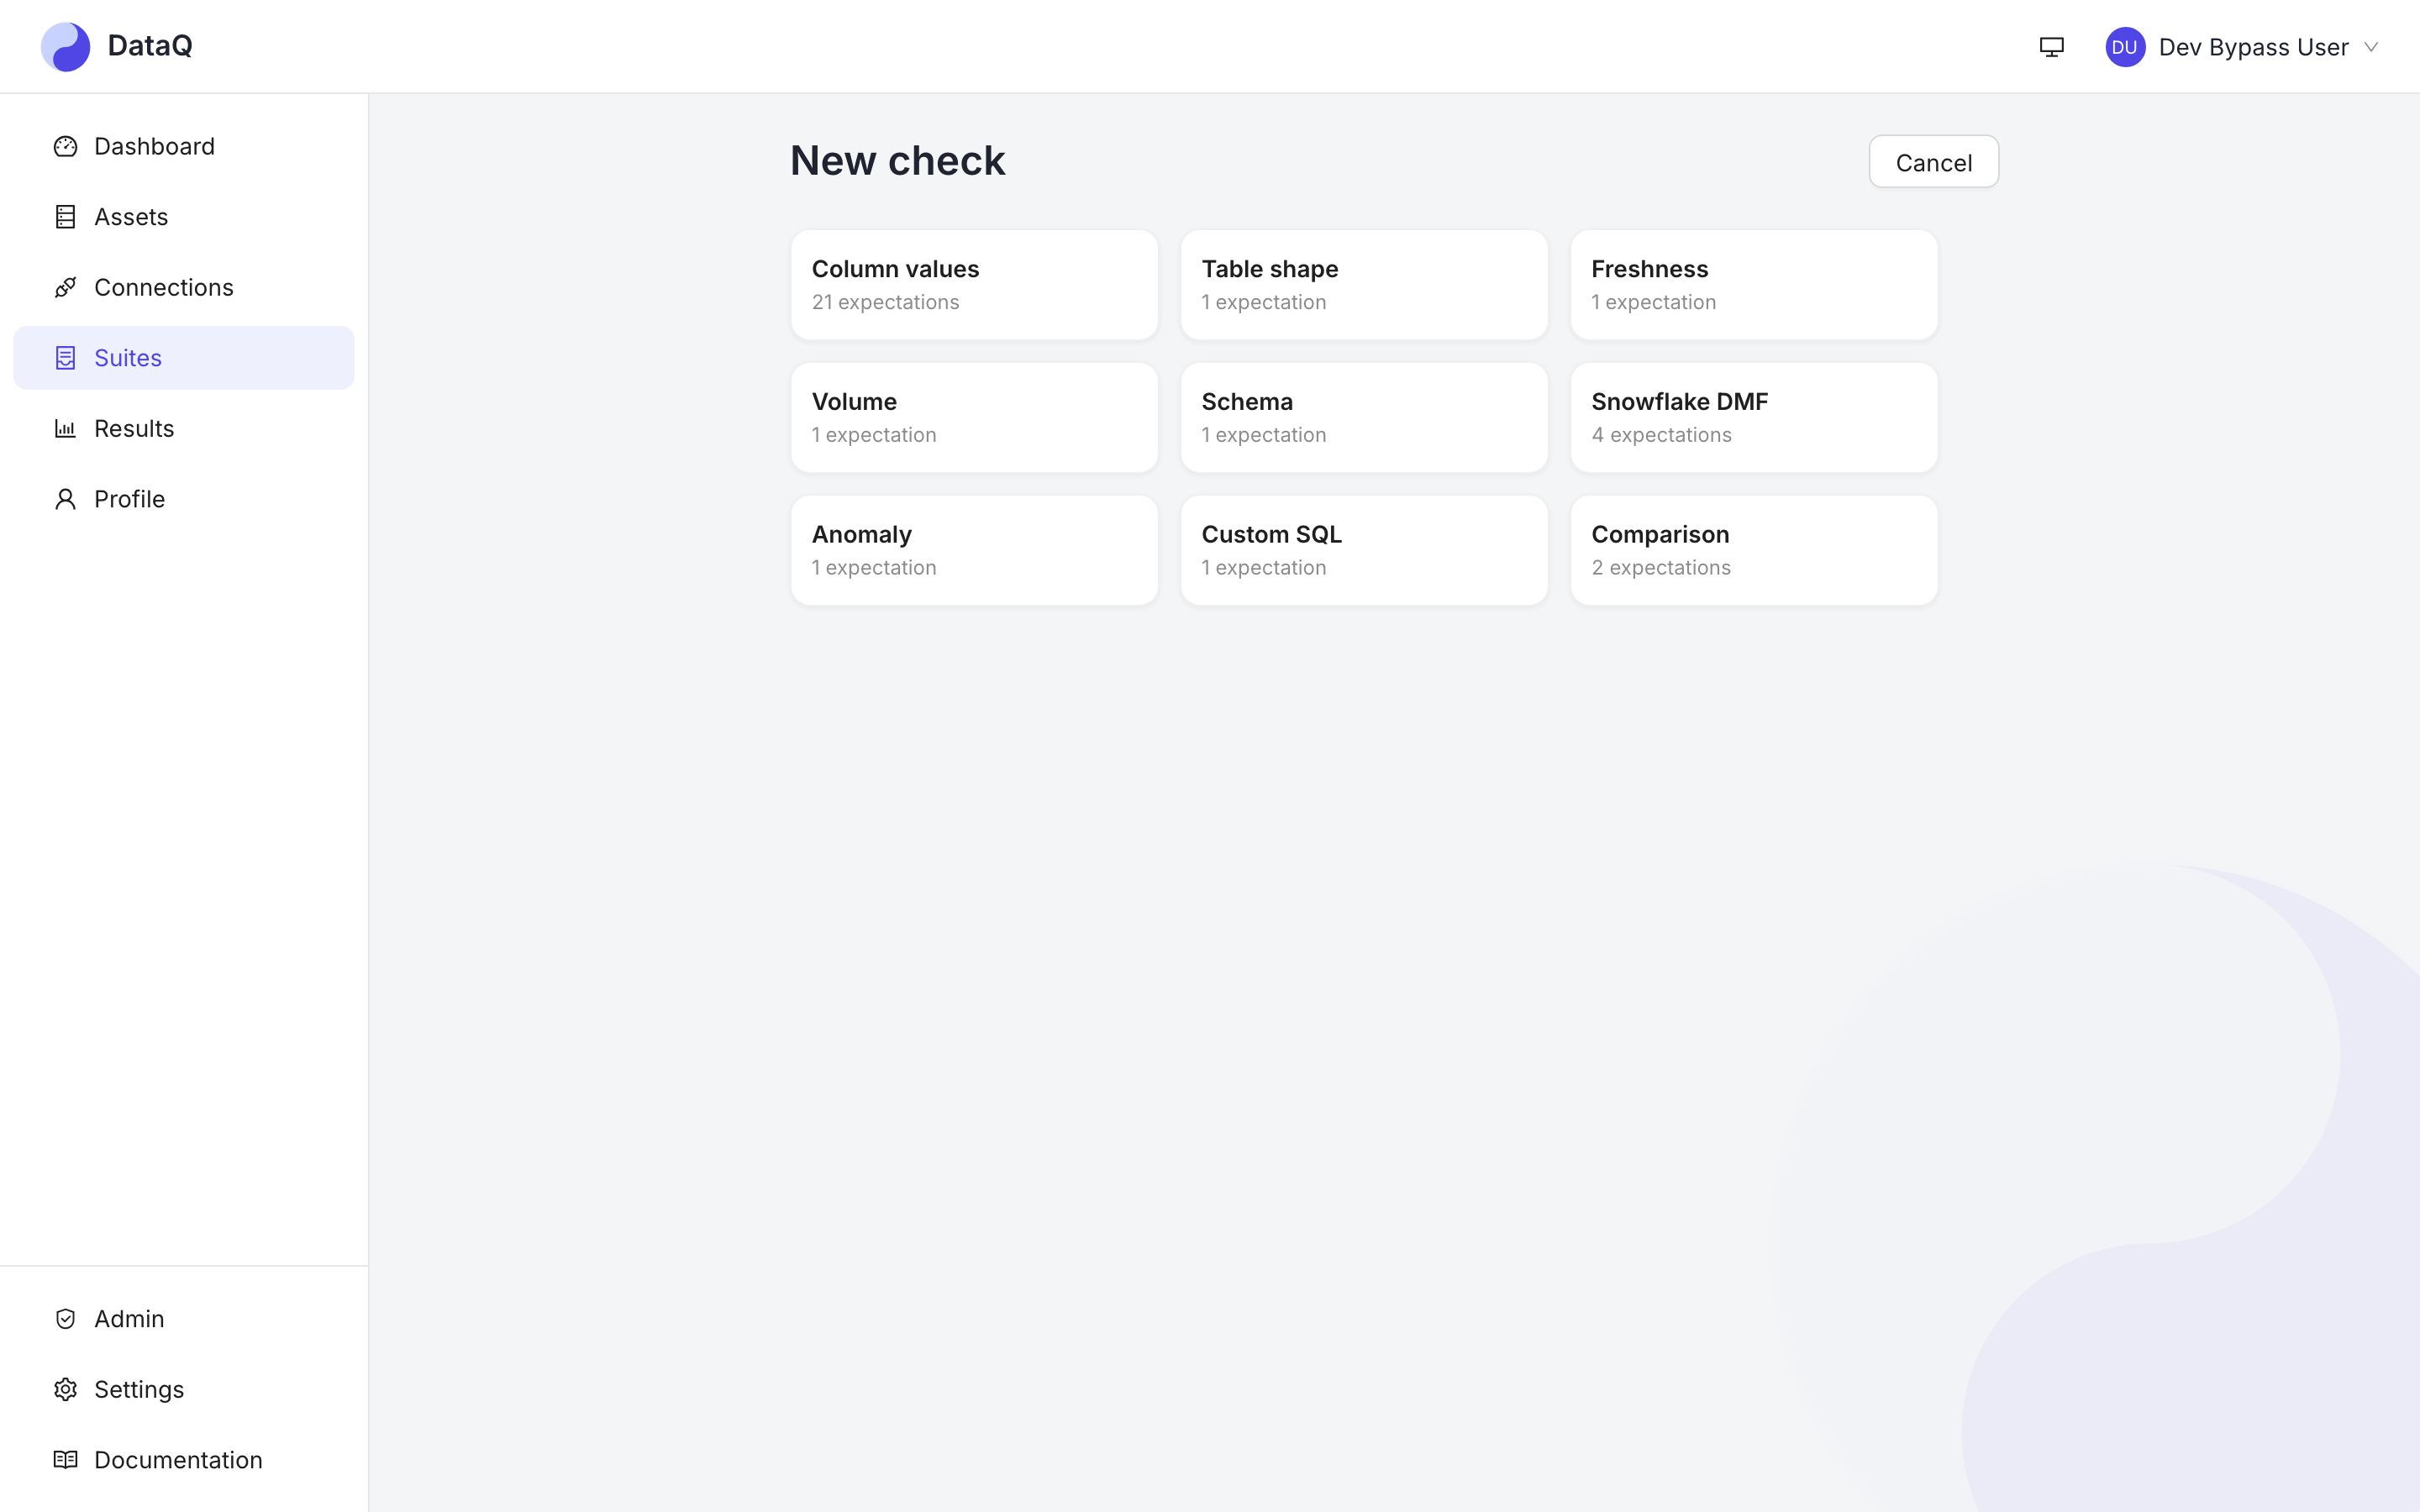
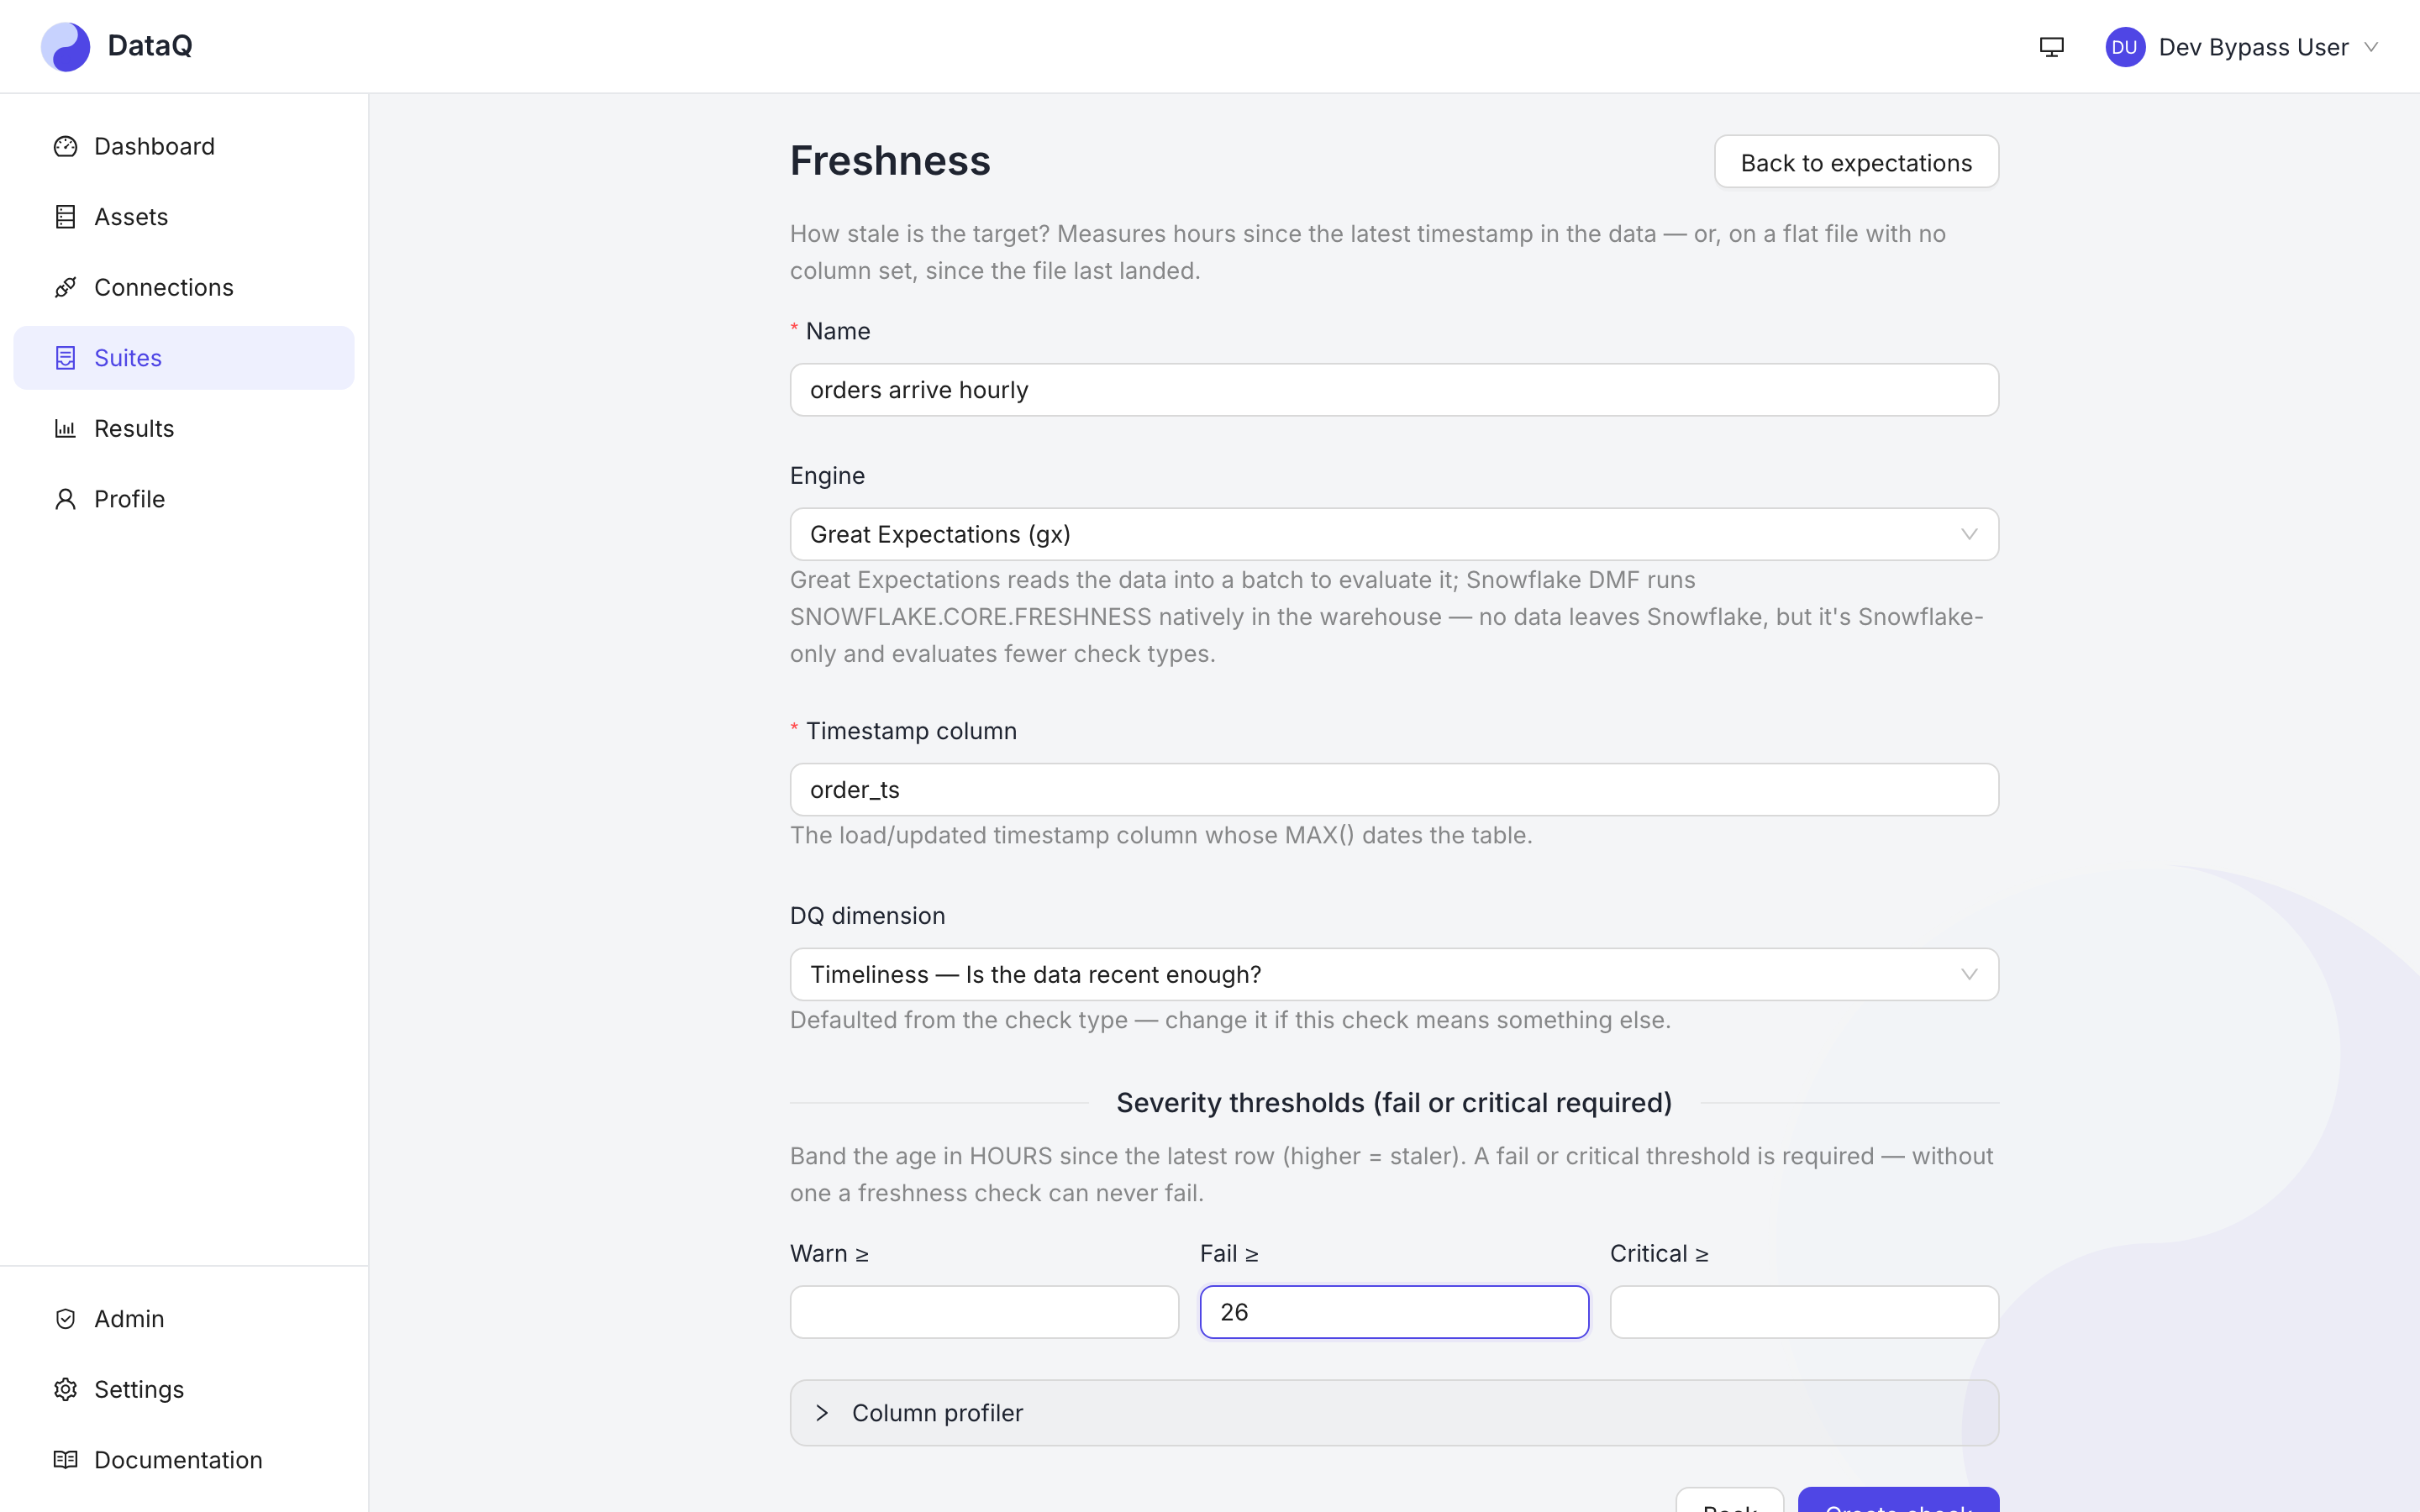
A freshness monitor. Add a check → Freshness, on the table's load/updated timestamp column. Set a fail threshold (e.g. fail if > 26 hours old for a daily load). Freshness/volume monitors require a fail or critical threshold.
-
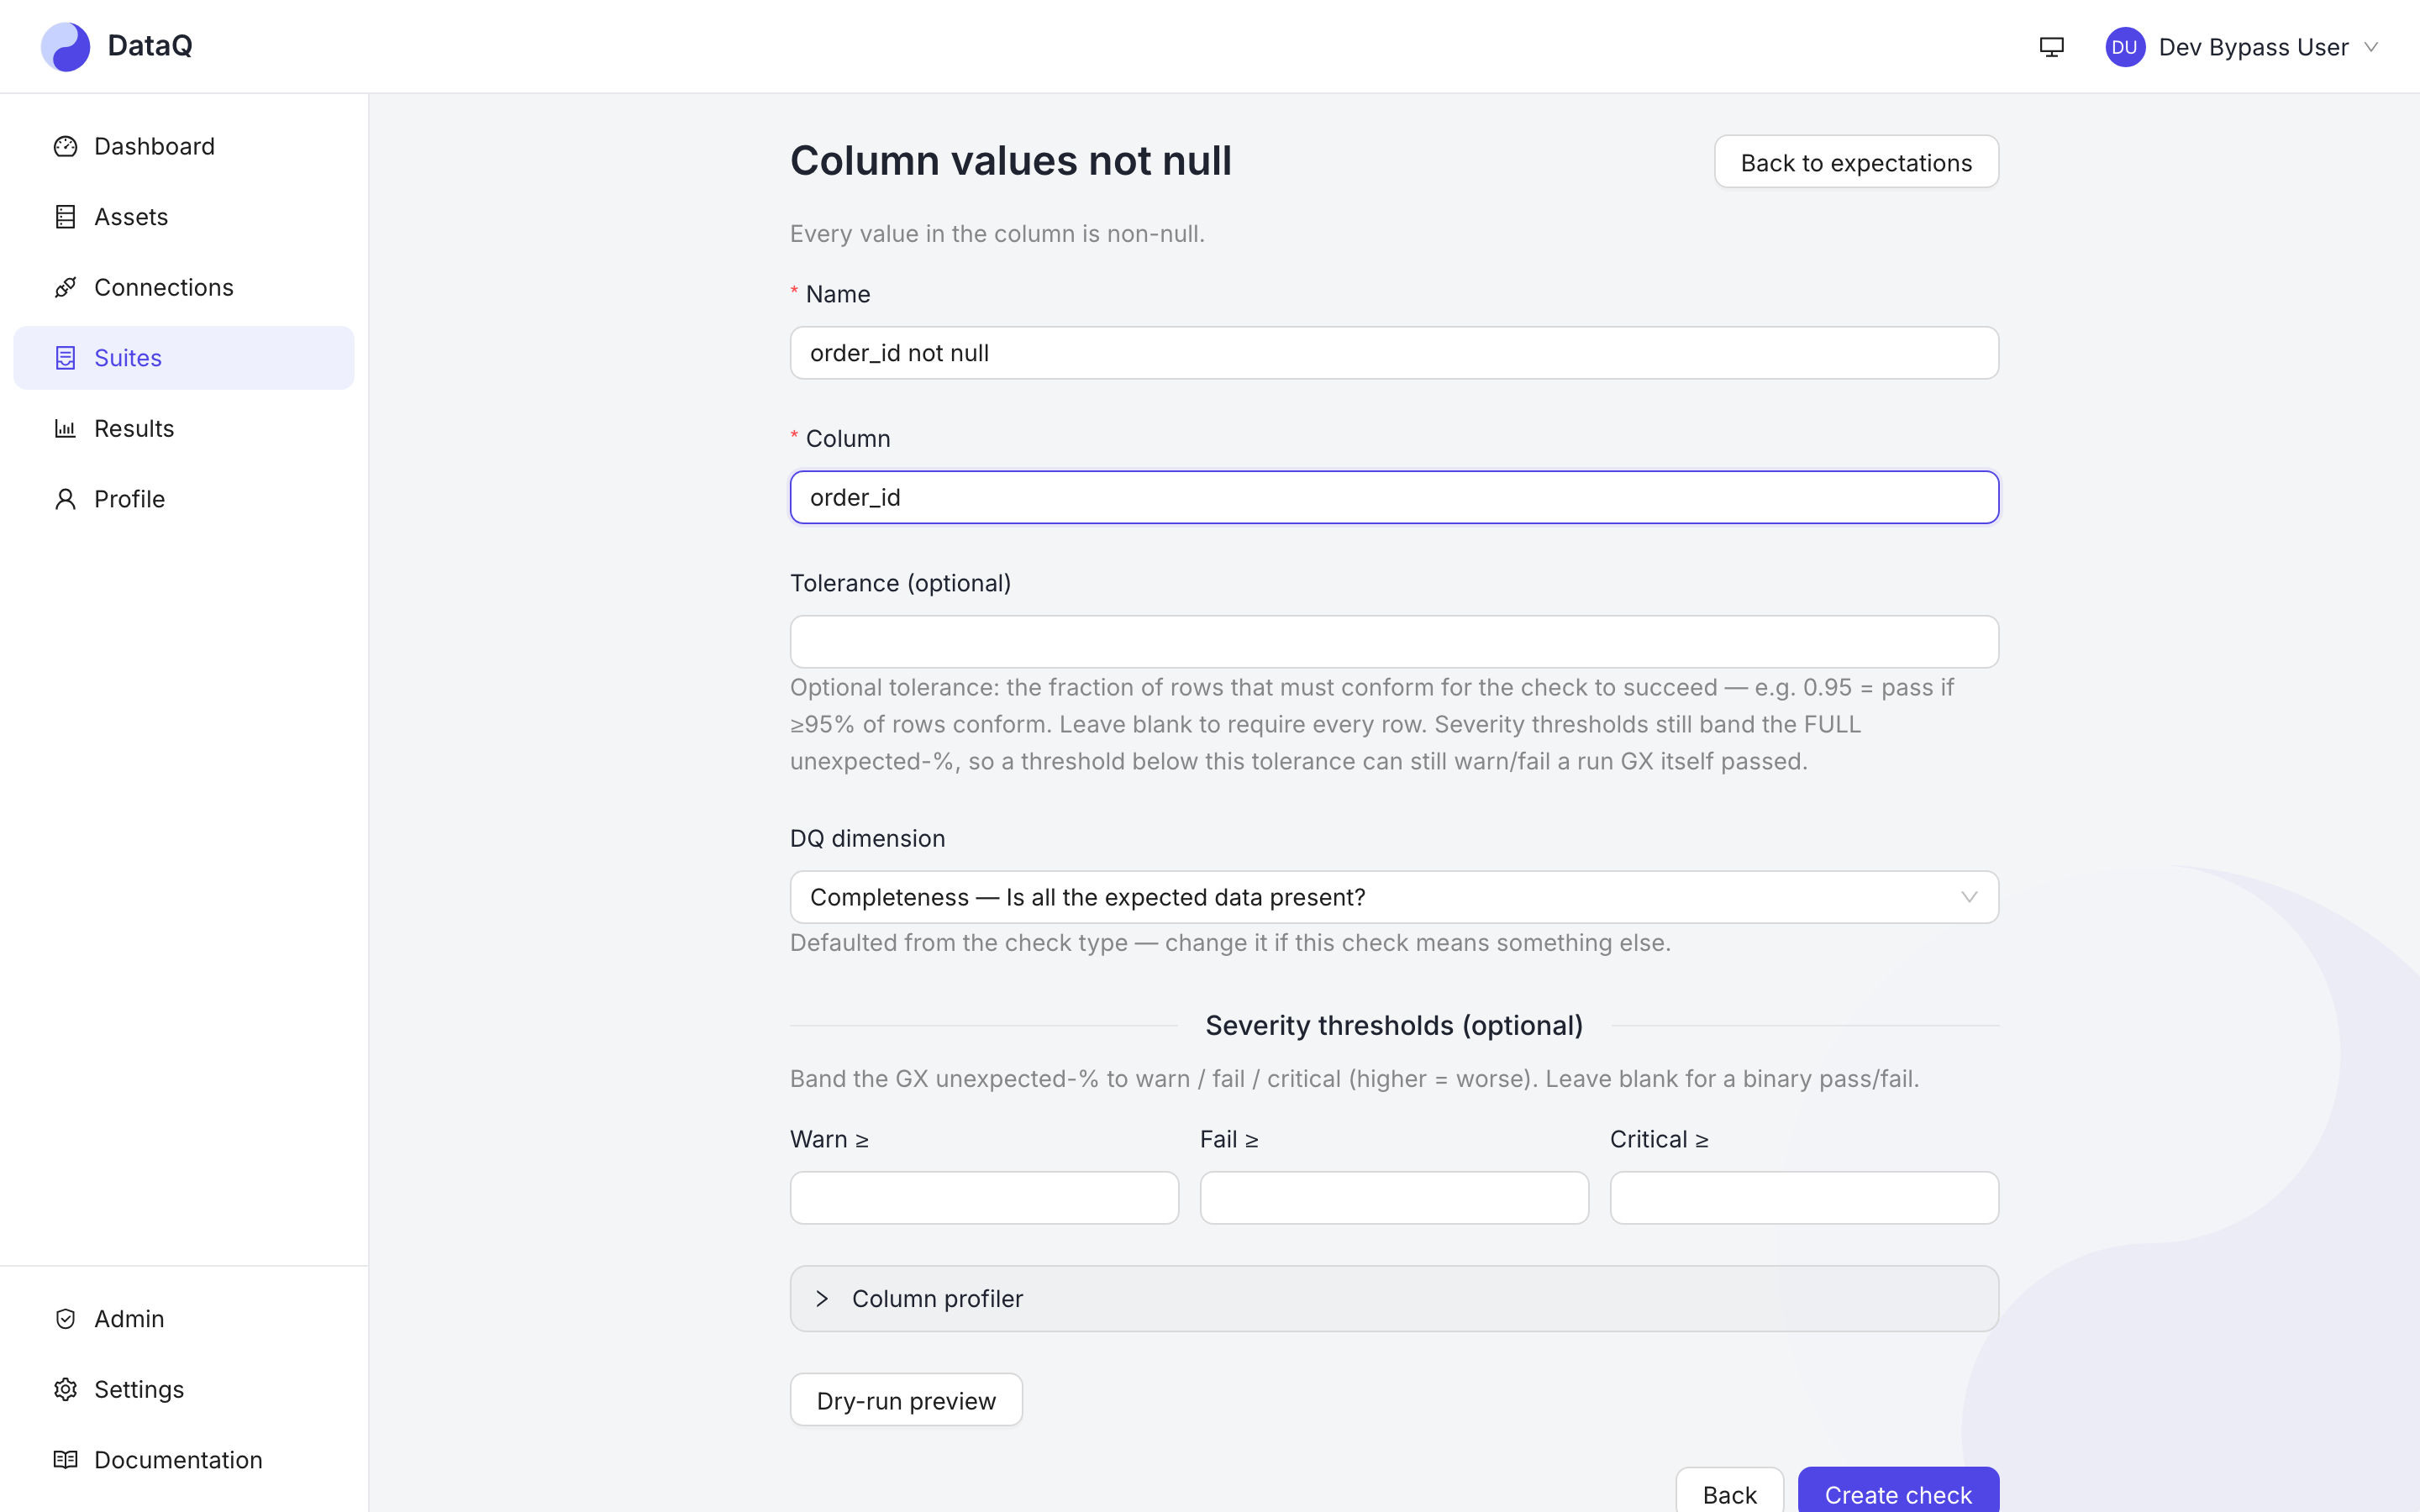
A value check. Add a check → a GX expectation like
expect_column_values_to_not_be_nullon a key column (e.g.order_id).Authoring a value check and reaching the dry-run preview (10 s)
-
Before saving the value check, click Dry-run to preview it against live data — you'll see the observed unexpected-% so you can set a warn threshold just above today's baseline (so it's green now, loud only when reality changes).
Tip: use the column profiler on a column to see nulls / distinct / min-max / top values while you decide what to check.
4. Run it
Open the suite's Run panel and click Run now. Watch the live per-check progress —
each check resolves to pass / warn / fail / critical (or the operational skip / error).
You can cancel a run mid-flight.
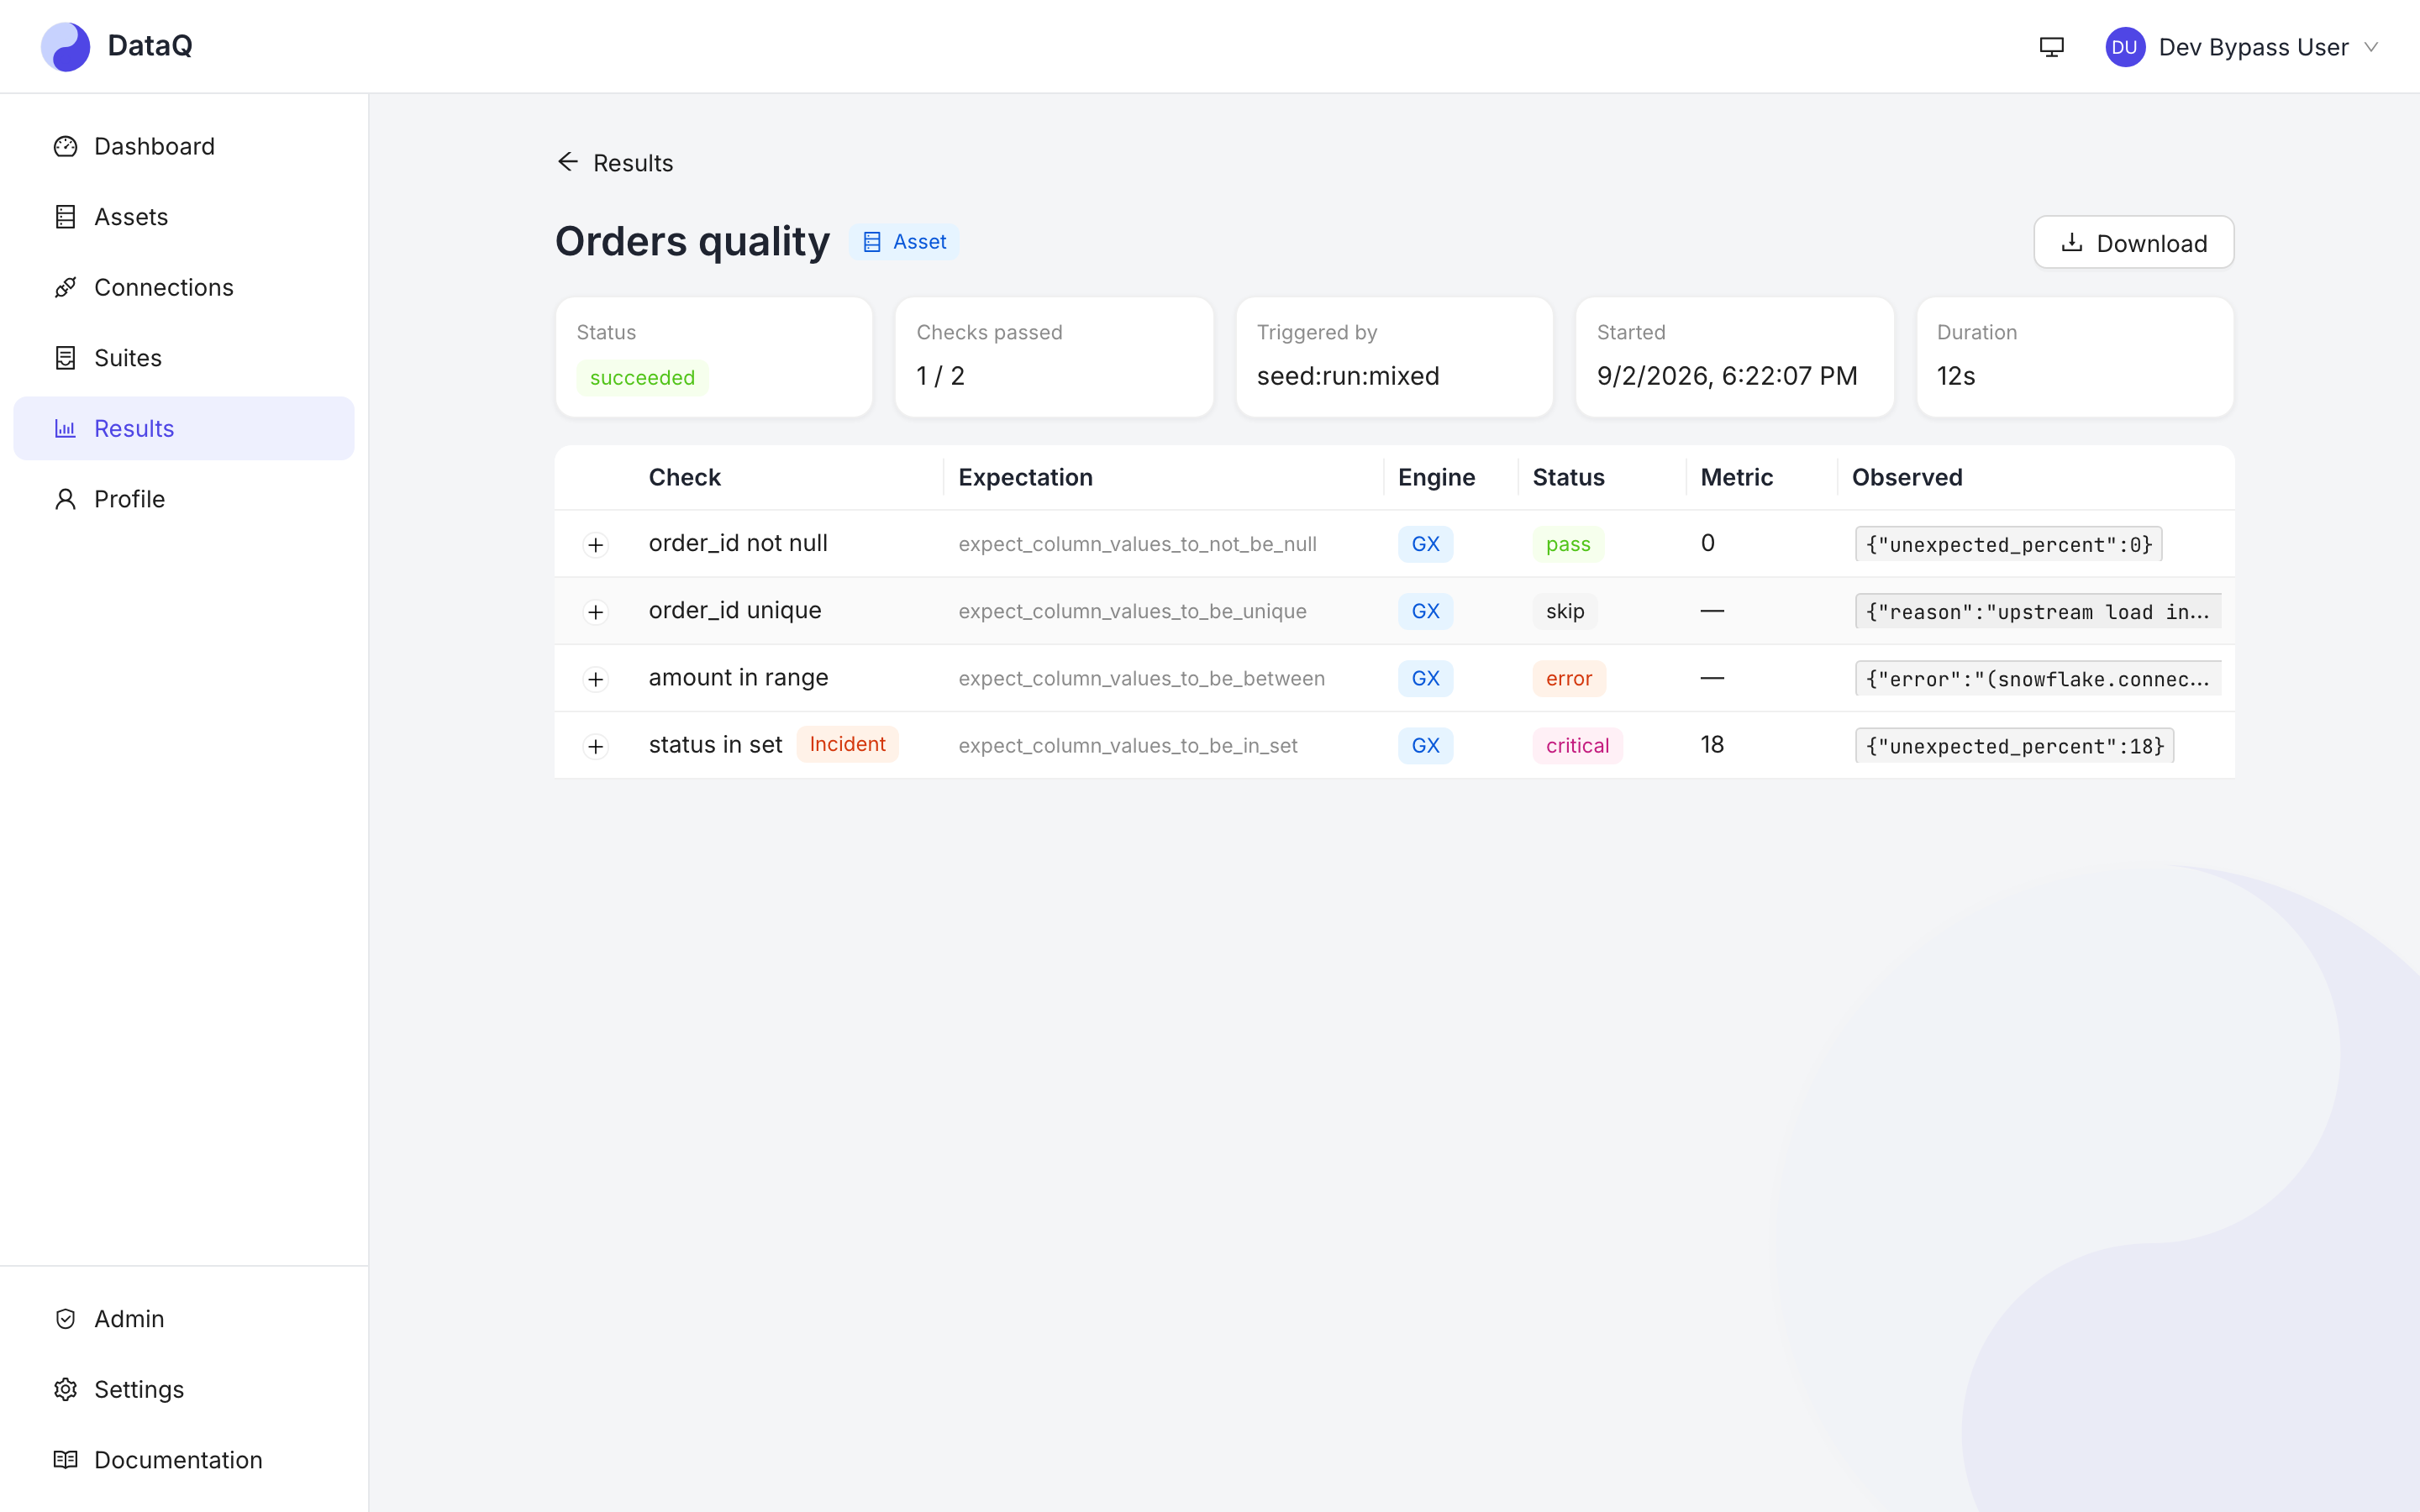
5. Read the result
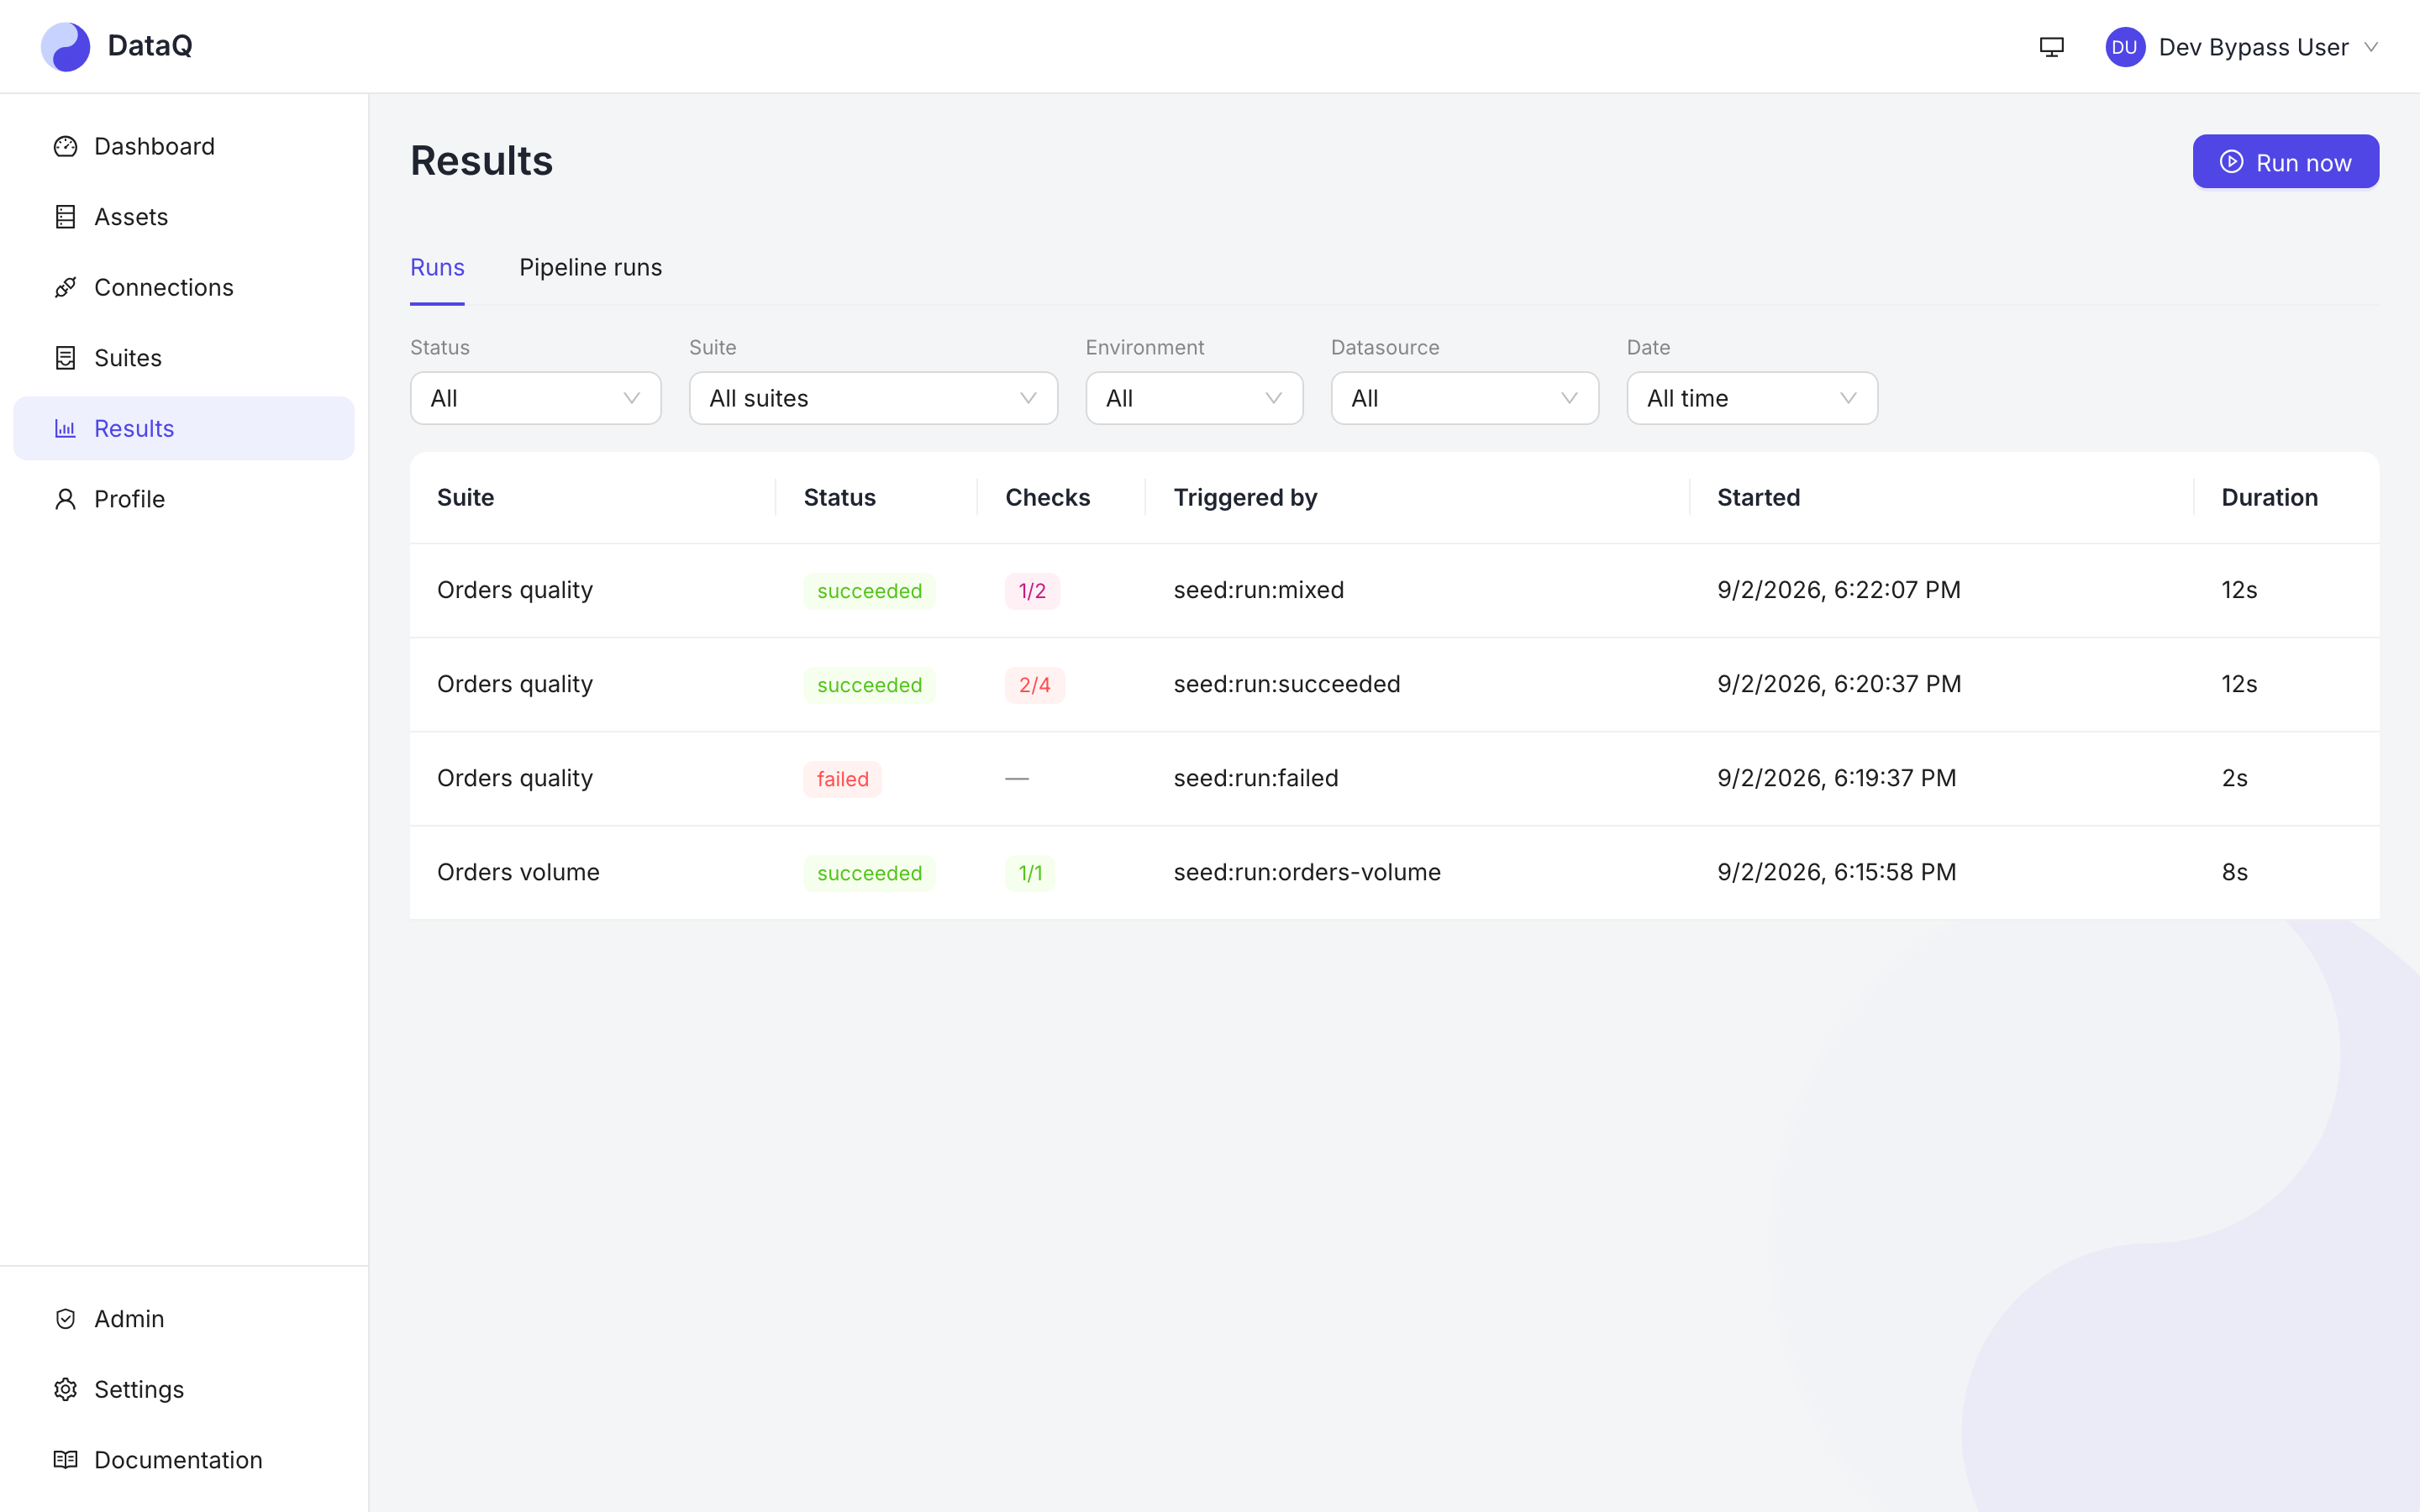
Go to Results and open the run:
Opening a run and expanding a failing check (6 s)
- Per-check outcomes with observed vs expected values.
- For a failing check, expand it to see the failing-row sample — redacted column-aware (PII masked; the counts and shape kept).
- The Dashboard now shows a health score, pass rate, and the start of a trend.
If a run failed to execute (bad credential, unreachable store), it shows a plain-language failure reason, not just "failed".
6. Get alerted
The short version is below; the full walk-through with screenshots is Your first alert.
-
On the suite, open Notifications and add a channel — Teams, Slack, or email — and pick a threshold (the default warn-and-worse is a good start).
-
Now a breaching run notifies you, with a deep link back to the run and the expected-vs-observed context. Dedup means you hear about a breakage once (and again if it escalates), not on every run.
7. Automate it
The short version is below; the full walk-through is Run it automatically.
- If an orchestrator loads this table (ADF / Airflow / dbt): open the suite's Triggers and bind it to the pipeline — the suite runs right after the pipeline succeeds, and results correlate to the pipeline run. See Orchestration.
- Otherwise: open Schedules and set a cron cadence matched to when the data arrives. See Scheduling.
Where to next
- Recommended usage — activate the rest of the features the right way.
- Best practices — the ongoing "signal, not noise" discipline.
- AI assistants (MCP setup) — drive all of this from Claude / Copilot / Cursor.